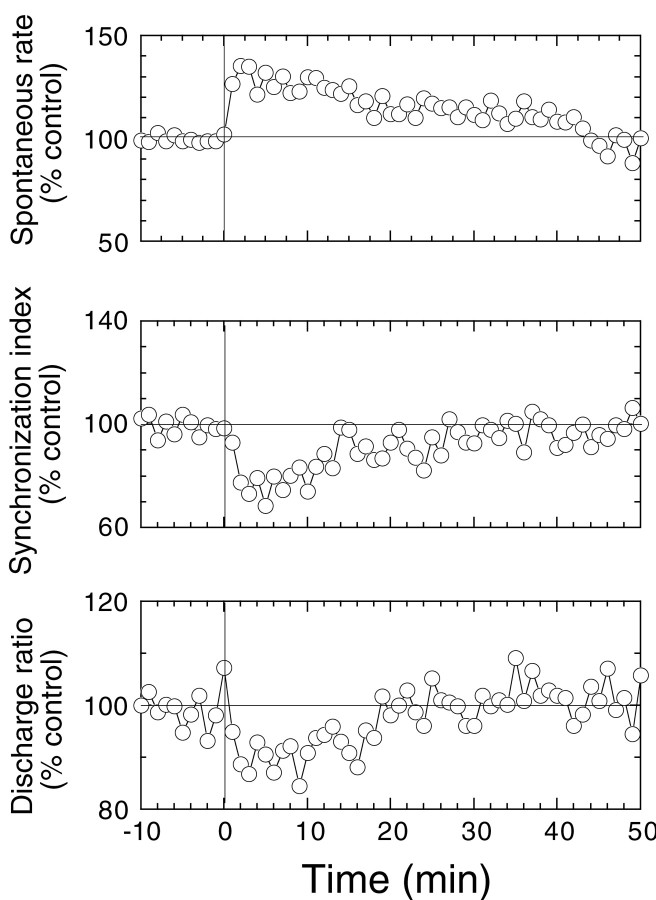
Fig. 5.
Time course of the change in spontaneous rate, SI, and DR with CGRP perfusion. CGRP was applied at time 0 at concentrations of 5–50 μm. Each data point represents the average for 10 animals in which displacements were 2 μm or smaller and responses were stable for 50 min or more. Data points for each variable were taken once per minute.

