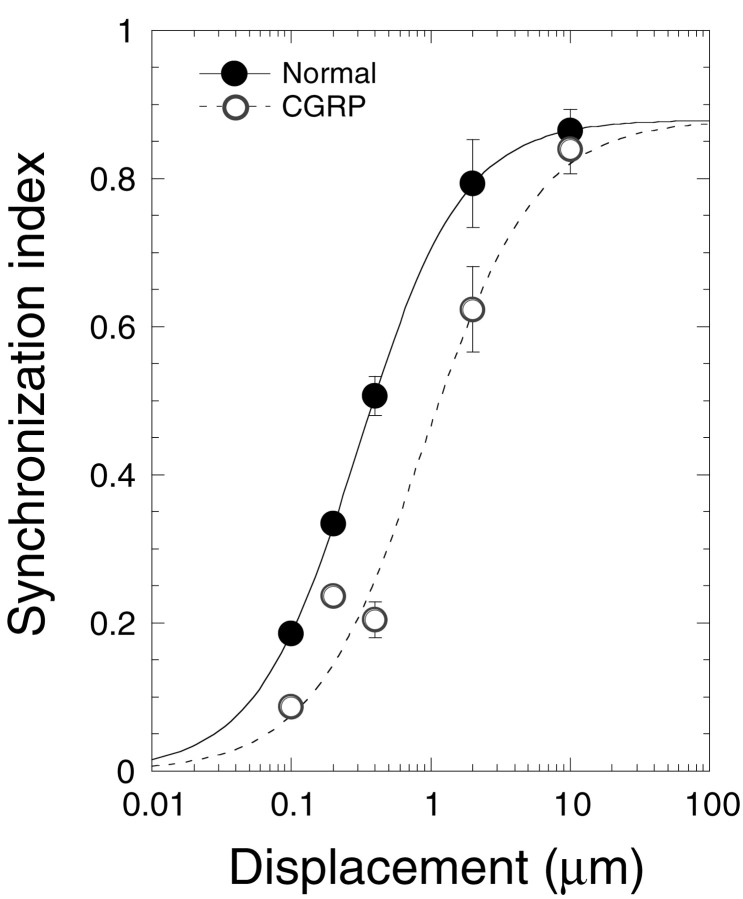
Fig. 7.
CGRP shifts the displacement–response function to higher displacement levels. Data (mean ± SE) taken before (filled circles) and after (open circles) CGRP administration are plotted on the same axes. SI values before and after CGRP administrations were normalized to the sigmoidal curve from Figure 2. A sigmoidal curve was fit to all of the CGRP data (dashed line) by a least squares regression analysis. The curve was constrained to the normal maximum SI. There were three cases at 10 μm, six cases at 2 μm, three cases at 0.4 μm, two cases at 0.2 μm, and one case at 0.1 μm.

