
Fig. 6.
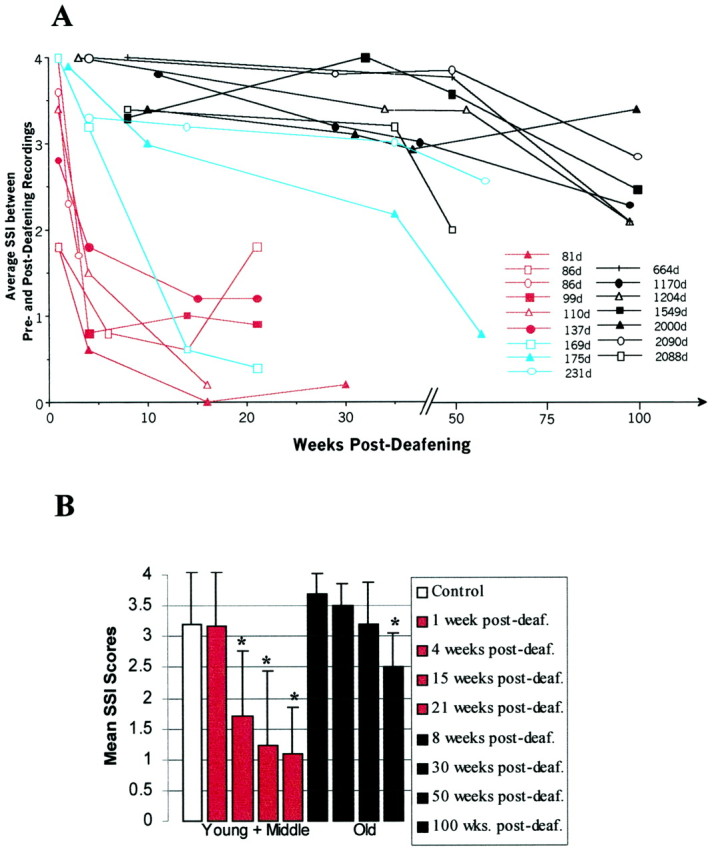
A, Song similarity index scores for all birds in this experiment plotted against time after deafening.Colors are used to identify adults that were young (red), middle-aged (blue), or old (black) at the time of deafening. Notice that song degradation, indicated by a declining similarity index, was greater and occurred faster in the birds deafened at the younger adult ages; birds deafened when they were older showed a slower decline.B, Mean similarity index scores for intact controls (whitebar) and for the different postsurgery intervals for birds deafened as young or middle-aged adults (redbars) or as old adults (blackbars). Birds in the two experimental groups were recorded at specified intervals after deafening, as shown in the box to theright of the figure. In each group'shistogram, these intervals become longer fromleft to right, corresponding to thetop to bottom listing inside thebox. The mean control score is very conservative in that it compared songs from the same individual recorded 2–5 years apart. Error bars indicate the SEM. An asteriskindicates significance at the level of p < 0.02 or better with respect to controls. Deaf., Deafening.