
Fig. 2.
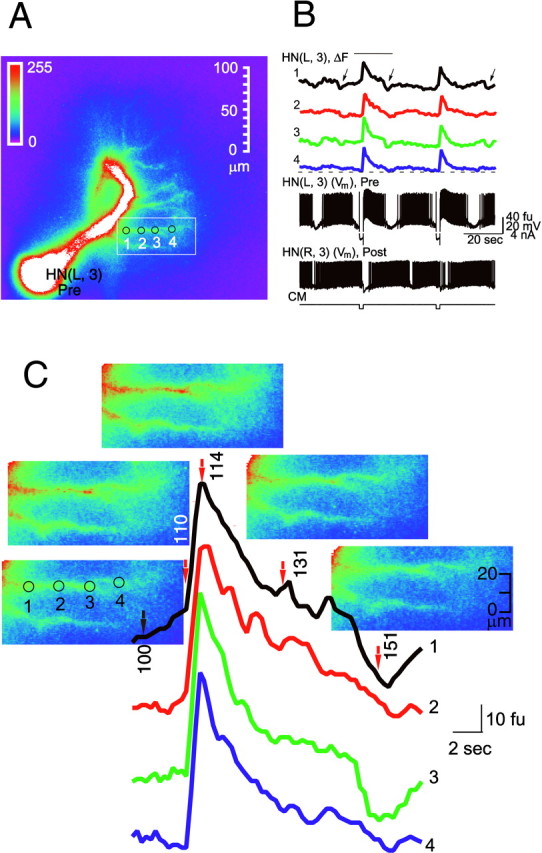
Ca fluorescence changes simultaneously along a fine medial branch of the main neurite in an oscillator interneuron during normal and perturbed activity. To image fine branches, the preparation was bathed in normal saline dorsal side up. Only one oscillator interneuron was filled with Ca Orange, but the membrane potential (Vm) of both interneurons (Pre and Post) in the ganglion was recorded. A, Fluorescence image of the HN(L,3) cell (Pre). B, Simultaneous recordings of electrical activity (Vm) and changes in Ca fluorescence (ΔF) at the sites indicated by numbers in A.Black arrows indicate artifacts (seen mainly at recording sites 1 and 3) caused by spontaneous movements of the ganglion. C, Fluorescence images superimposed on expanded section of Ca fluorescence record (B, bar).Red arrows indicate the points on the records, corresponding to the numbered images. CM, Current monitor of current injected in to cell HN(L,3). Ca fluorescence (ΔF) was monitored at 4–7 Hz.