
Fig. 4.
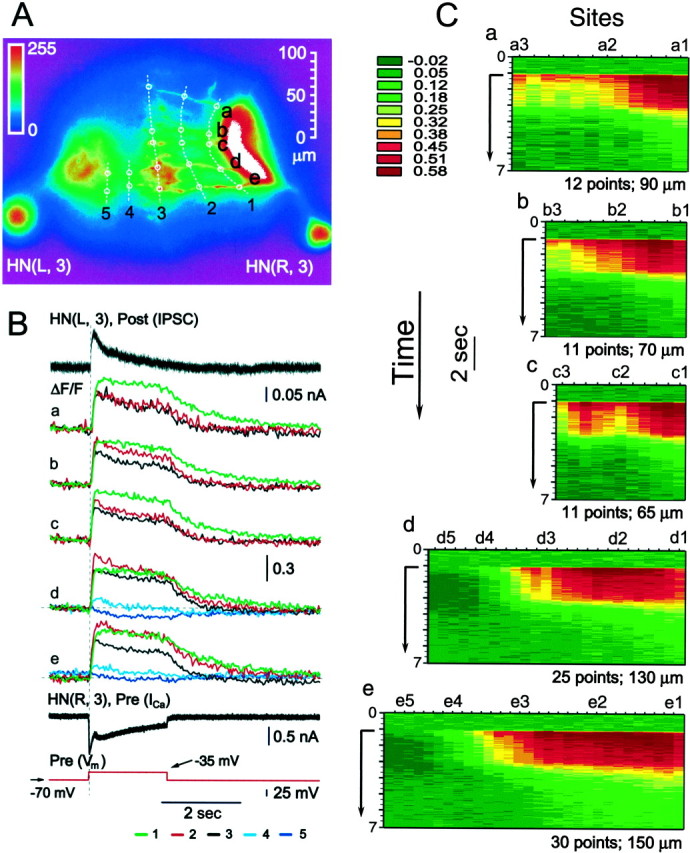
Spatial and temporal pattern of normalized changes in Ca fluorescence in response to a depolarizing voltage pulse in a pair of oscillator interneurons. Here and in Figure 10, to make records from sites with very different baseline fluorescence more comparable, Ca fluorescence is presented as ΔF/F. A, Image of preparation (dorsal side up) showing sites (1–5) for recording ΔF/F on a set of neuritic branches (a–e). Five major branches (a–e) were imaged in the HN(R,3) cell that was designated presynaptic (Pre). Two corresponding branches were imaged in the HN(L,3) cell that was designated postsynaptic (Post). Dashed white lines link corresponding recording sites on the branches. Site 4 and all points lateral, including site 5, are postsynaptic, and site 3 and all points lateral, including sites 2 and 1, are presynaptic. Points between sites 3 and 4 are in the region of Pre/Post overlap; note, that the changes in Ca fluorescence in this region are predominantly of the presynaptic type (see Results for explanation.). B, Simultaneous recordings of presynaptic low-threshold Ca currents (ICa) and normalized changes in Ca fluorescence (ΔF/F) and IPSCs in voltage clamp. The preparation was bathed in 0 mm Na+/5 mm Ca2+ saline and repeated (n = 4; average traces shown) depolarizing voltage pulses to −35 mV (from a holding potential of −70 mV) was imposed on the presynaptic cell. The postsynaptic cell was held at −40 mV.C, Pseudocolor representations the spatial and temporal pattern of normalized changes in Ca fluorescence (ΔF/F) along each of the five branches (a–e) labeled in A. Data from the experiment in B. Time axis (y-axis) starts at the top of each panel and progresses along the arrow. Time 0 corresponds to the beginning of the traces in B and the start of the arrow to the time of the voltage pulse in B. Each tick on the site axis (x-axis) represents an equally spaced fluorescence recording site with the sites illustrated inA labeled correspondingly. The number of recording sites and the total length of the branch monitored are indicated for each branch. Normalized changes in Ca fluorescence (ΔF/F) recorded at 30 Hz. Thus in all graphs the time axis is binned in 33 msec intervals.