
Fig. 4.
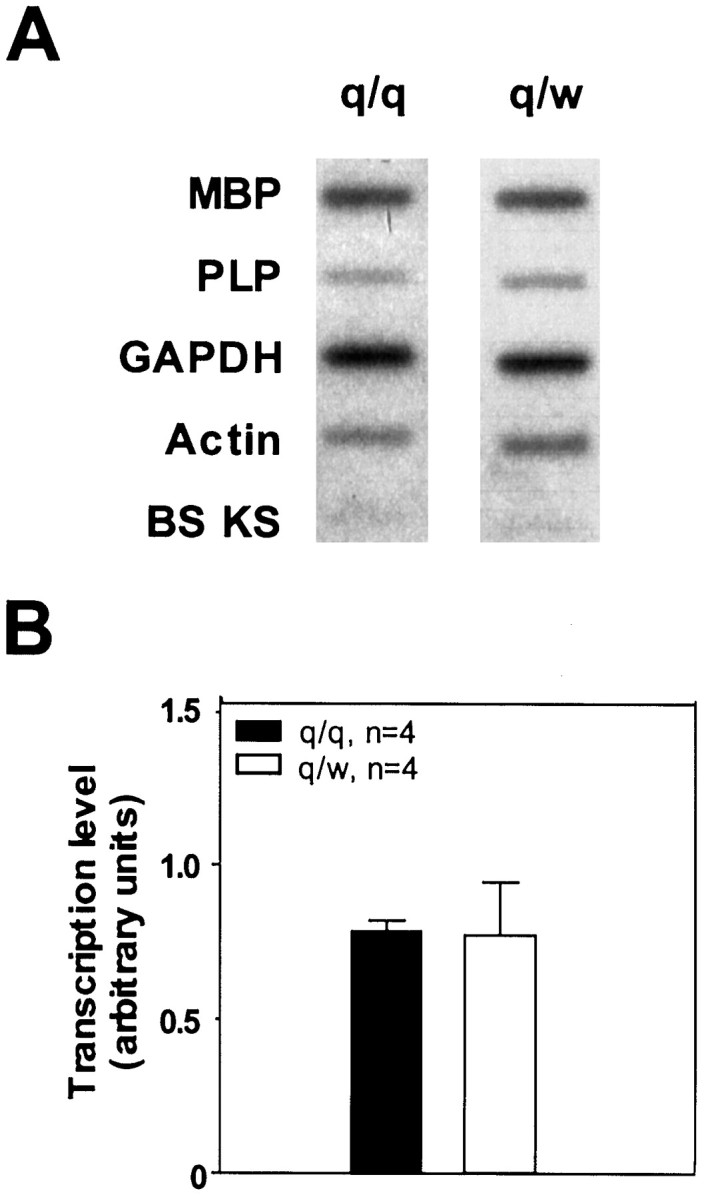
Comparable MBP transcription level at P17 in qkv/qkv and qkv/wt brain estimated by the nuclear run-on assay.A, Representative phosphorimage of a nuclear run-on experiment. Plasmids containing various cDNA or empty Bluescript vector (10 μg each), as indicated on the left, were immobilized on the membrane. B, Transcription level of MBP in qkv/qkv and qkv/wt littermates at P17–P18 represented by PhosphorImager reading of MBP signal normalized to that of GAPDH (n = 4). SE is indicated for each group.