
Fig. 4.
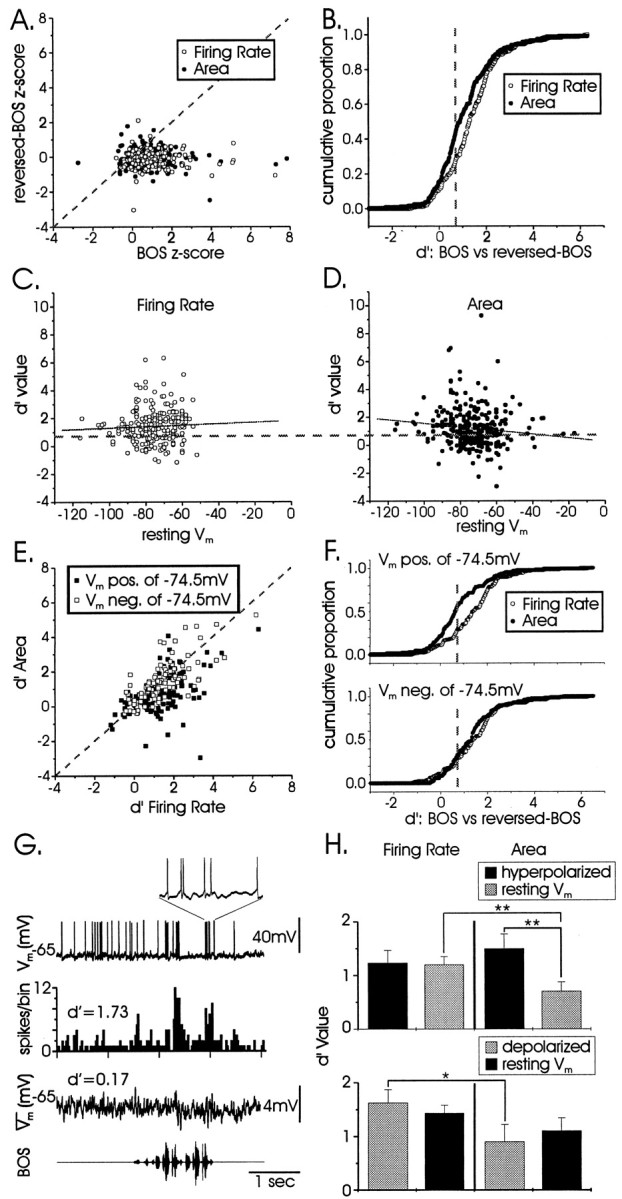
A population analysis of LMAN projection neurons reveals equivalent song selectivity at subthreshold and suprathreshold levels. A, Normalized responses (z-scores) to BOS are plotted against those to reversed BOS, for both suprathreshold (firing rate) and subthreshold (area) activity (n = 299 cells). The points to theright of the diagonallineare cells with a bias for forward song. B, The discrepancy between subthreshold and suprathreshold selectivity for all spiking cells (n = 235) is plotted as a cumulative proportion of d′ values. The dashedverticalline indicates the criterion for significant selectivity (d′ = 0.7). C, D, Scatter plots of suprathreshold and subthreshold d′values with resting Vm show a significant negative correlation for area (r = −0.13;p = 0.027) but no significant correlation for firing rate (r = 0.05; p = 0.47). E, Suprathreshold versus subthreshold selectivity for d′ values comparing BOS and reversed BOS, for all cells with spiking activity (n = 235), is shown. Positive-resting cells (black; n = 125) are less selective at subthreshold than at suprathreshold levels, whereas negative-resting cells (white;n = 110) are equally selective at subthreshold and suprathreshold levels (see Discussion). The diagonalline represents equal subthreshold and suprathreshold selectivity. F, The discrepancy between subthreshold and suprathreshold selectivity exists only for positive-resting (top) and not negative-resting (bottom) cells; data from E are plotted as cumulative proportions of subthreshold and suprathreshold d′ values.G, An example of a cell that exhibited suprathreshold but not subthreshold selectivity is shown; contrast with the cell depicted in Figure 2E. The toptrace and inset show a response to one presentation of BOS; note how the spikes arise from the baseline with minimal subthreshold EPSPs. Conventions are as described in Figure 2E. H,Hyperpolarization (top; n = 26) and depolarization (bottom; n = 12) of single cells with tonic current did not alter their firing-rate selectivity. Consistent with the discrepancy shown in F, a mismatch between subthreshold and suprathreshold selectivity arose when cells were more positive resting (graybars, top and bottom). Subthreshold selectivity (area) increased when cells were more negative resting, although this was only significant for hyperpolarized cells.d′ values from cells with negative-resting potentials are shown in black, and those with positive-resting potentials are shown in gray (paired ttests, *p < 0.05; **p < 0.01).