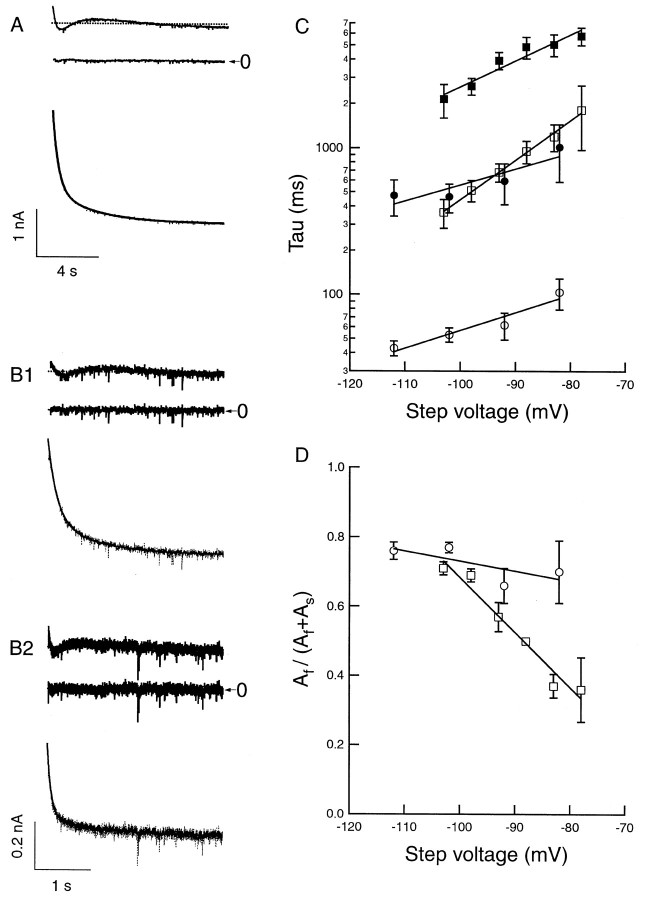
Fig. 11.
Comparison of biexponential activation kinetics of Ih current in native neurons. A, B, Double exponential fit of current traces for thalamic relay neuron (A), hippocampal OA interneuron (B1), and hippocampal CA1 pyramidal neuron (B2) during hyperpolarizing voltage step to −103 mV. Step length was 11.2 sec for thalamocortical relay cell and 3 sec for hippocampal cells. From bottom, traces show superimposed currents and biexponential fits, residuals from biexponential fits, and residuals from single exponential fits. C, “Fast” (open symbols) and “slow” (filled symbols) time constants of activation as function of voltage for thalamic relay neurons (squares) and hippocampal CA1 pyramidal neurons (circles); n = 4.D, Relative amplitude of the fast exponential component as function of voltage. Circles, Hippocampal CA1 neurons. Squares, Thalamic relay neurons.

