
Fig. 2.
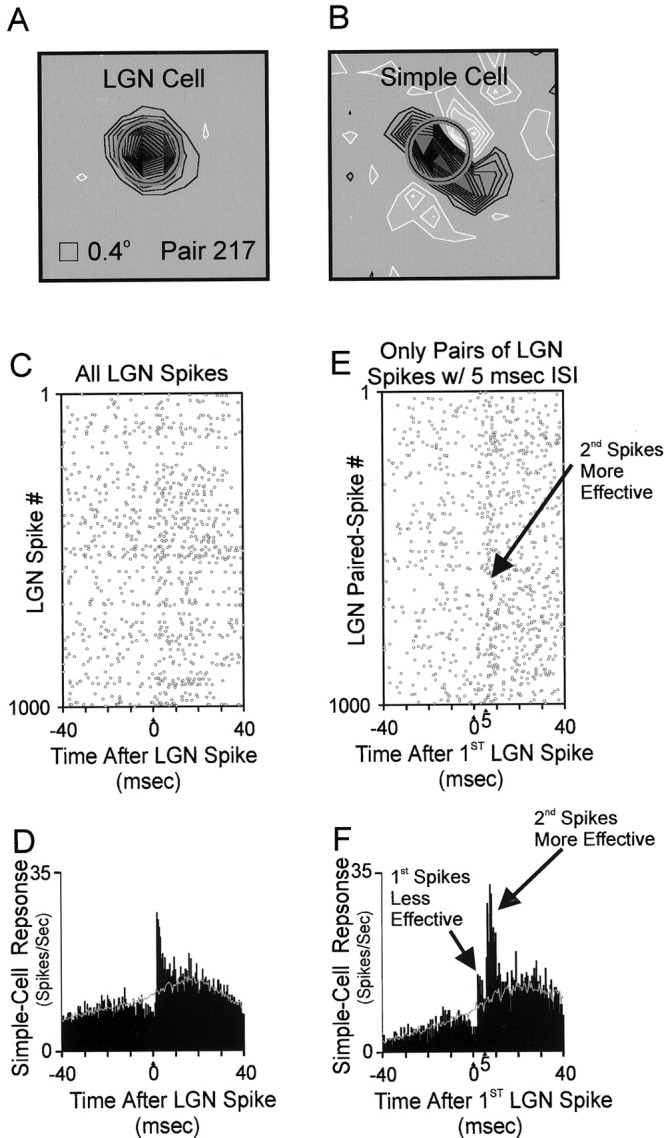
Comparison of the effectiveness of two geniculate spikes (interspike interval = 5.0 ± 0.2 msec) from the same geniculate cell. A, B, Receptive fields of a geniculateoff-cell and cortical simple cell mapped with white noise (details as in Fig. 1). C, Raster plot of simple-cell spikes relative to 1000 geniculate spikes. The simple cell often fired ∼2 msec after a geniculate spike. D, Cross-correlogram, which is equivalent to the sum of all rows of the raster plot (C); units are simple-cell spikes per second after the average geniculate spike. The narrow, short-latency peak [above the stimulus-dependent shuffle correlogram (gray line);Perkel et al. (1967)] indicates that the geniculate cell provided monosynaptic input to the simple cell (Tanaka, 1983, 1985; Reid and Alonso, 1995). Visual stimulus: drifting sine-wave grating of optimal orientation. Total time: 2062 sec. Geniculate spikes: 64,779; simple-cell spikes: 8635. Efficacy of geniculate input: 2.1% (see Materials and Methods). E, Raster plot of simple-cell firing relative to 1000 pairs of geniculate spikes, each separated by 5.0 ± 0.5 msec and preceded by > 5.0 msec dead time. More simple-cell spikes followed second geniculate spikes than followed first geniculate spikes. F, Cross-correlogram between paired geniculate spikes and simple-cell spikes. Geniculate paired spikes: 5450. Efficacy of first spikes (peak 1): 1.2%. Efficacy of second spikes (peak 2): 5.1%.