
Fig. 2.
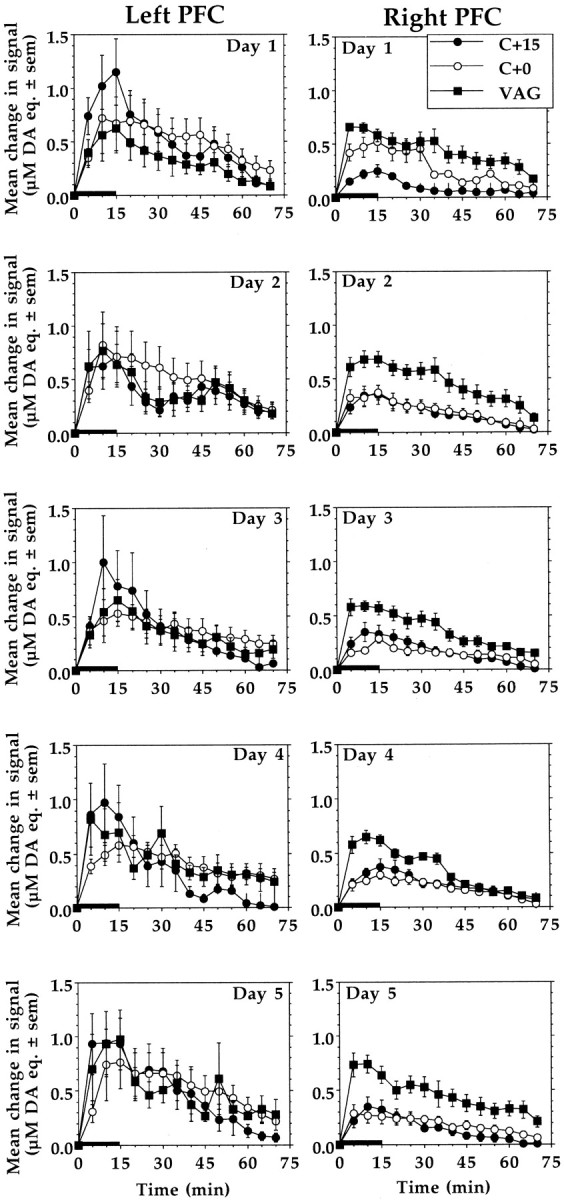
Mean ± SEM increases of DA signals recorded in left and right PFC in response to each of five once-daily episodes of tail-pinch stress. Overall, the right but not the left PFC DA stress responses in C + 15 and C + 0 animals were significantly smaller than in VAG controls (p < 0.01; Tukey's HSD). However, on the first test day, right PFC DA responses were significantly attenuated only in C + 15 animals (p < 0.05; Tukey's HSD). Length ofhorizontal bar corresponds to the duration of the stress period.