
Fig. 3.
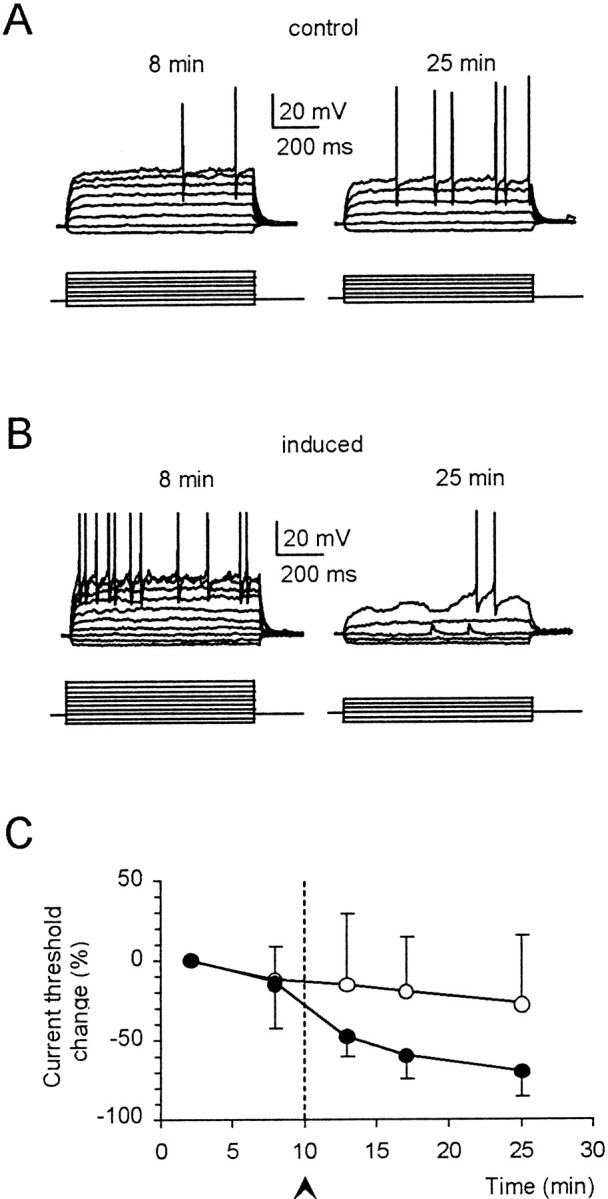
Enhanced action potential generation during LTP. Granule cell responses to current injection (bottom tracings, 2 pA/step) from −80 mV are compared in (A) control recordings and in (B) recordings in which LTP was induced (this cell was one of those included in Fig.2A1). Tracings were taken 8 and 25 min after the beginning of recordings. C, Time course of the current needed to fire action potentials (current threshold) in control recordings (○; n = 5) and in recordings in which LTP was induced (●; n = 10). Note the marked decrease in current threshold during LTP.