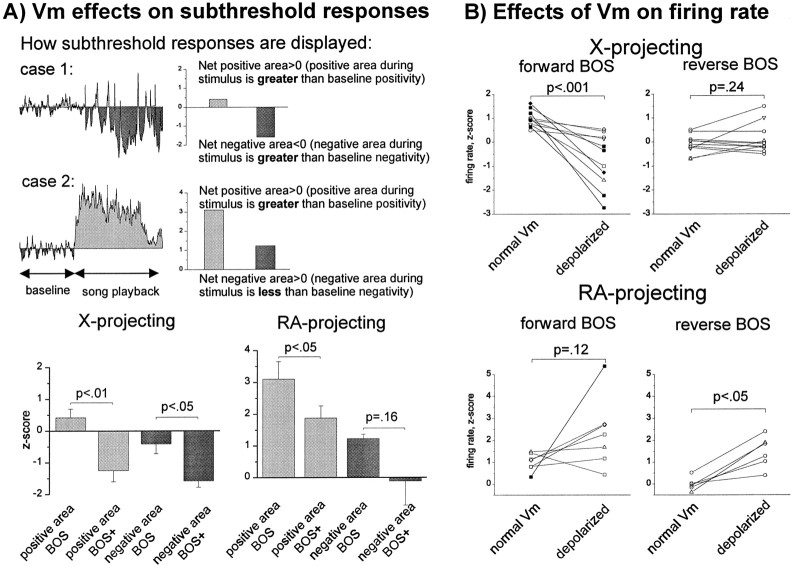
Fig. 9.
Population analyses of the effects of tonic depolarization on subthreshold responses in the two relay cell types indicate that X-projecting neurons display a mixture of inhibition and excitation evoked primarily by forward BOS, whereas RA-projecting neurons display predominantly excitatory responses to both forward and reverse BOS. A, Top, An example of how the positive and negative subthreshold responses to forward and reverse BOS playback were measured is shown. Positive or negative z-scores were generated from positive or negative integrals calculated relative to a baseline mode value, either before or during stimulus presentation; the prestimulus positive area was then subtracted from the BOS-evoked positive area to generate a positive area score (lightly shaded; values > 0 correspond to a net increase in positivity during stimulation). A similar subtraction was performed with the negative integrals, which were then multiplied by −1 to generate a negative area score (darkly shaded; values < 0 correspond to a net increase in negativity during playback). Bottom Left, The means (± SEM) of the subthreshold positive and negative area z-scores for X-projecting neurons in their control and tonically depolarized states (Vcontrol = −76.5 ± 2.1 mV vs Vdepolarized = −57.6 ± 3.5 mV;p < 0.001; n = 11 cells) are shown. Depolarization altered the responses of X-projecting neurons so that they were net negative. Positive area: ZareaBOScontrol = 0.42 ± 0.27; ZareaBOSdepolarized = −1.25 ± 0.35;p < 0.01, paired t test. Negative areas: ZareaBOScontrol = −0.41 ± 0.30; ZareaBOSdepolarized = −1.58 ± 0.20;p < 0.05, paired t test.Bottom Right, Subthreshold positive and negative area z-scores (± SEM) for RA-projecting neurons in their control and tonically depolarized states (Vcontrol = −79.6 ± 2.8 mV vs Vdepolarized = −57.4 ± 3.2 mV;p < 0.0001; n = 8 cells) are shown. Mean responses were highly positive in either state. Positive areas: ZareaBOScontrol = 3.1 ± 0.55; ZareaBOSdepolarized = 1.87 ± 0.38;p < 0.05, paired t test. Negative areas: ZareaBOScontrol = 1.23 ± 0.13; ZareaBOSdepolarized = −0.11 ± 0.76; p = 0.16, paired t test.B,Top, In X-projecting neurons, tonic depolarization significantly depressed firing rates to forward BOS playback, without affecting firing-rate responses to reverse BOS playback. Mean firing rates: ZcontrolBOS = 0.97 ± 0.10 versus ZdepolarizedBOS = −0.73 ± 0.34;p < 0.001, paired t test; ZcontrolBOSrev = −0.09 ± 0.12 versus ZdepolarizedBOSrev = 0.12 ± 0.19;p = 0.24; n = 11 cells.Bottom, In RA-projecting neurons, tonic depolarization resulted in a significantly elevated firing-rate response to reverse BOS playback and a trend toward elevated firing to forward BOS playback. Mean firing rates: ZcontrolBOS = 1.01 ± 0.15; ZdepolarizedBOS = 2.34 ± 0.60;p = 0.12, paired t test; ZcontrolBOSrev = 0.14 ± 0.19; ZdepolarizedBOSrev = 1.47 ± 0.29;p < 0.01; n = 6 cells (1 of the 7 cells was depolarized strongly enough to inactivate spiking totally and thus is not included here; also note that only a significant effect on reverse BOS was observed but that the mean response to forward BOS more than doubled in the depolarized state).

