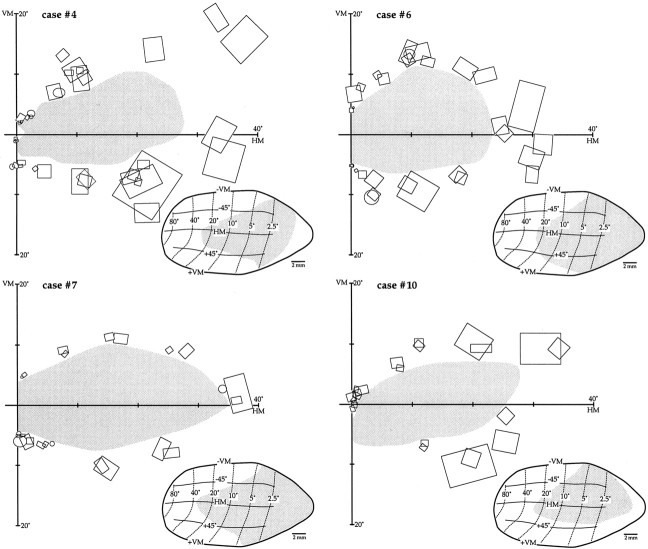
Fig. 2.
Extent of the V1 lesions and scotomas in four animals. For each case, the estimated extent of the scotoma (gray) is indicated on a view of the central 40° of the visual field (HM and VM). The receptive fields of V1 neurons used as the basis for this estimate, which were recorded at sites near the lesion border, are also illustrated (rectangles and ovals). Theinsets at the bottom of each diagram show a projection of the extent of the scotoma on an averaged map of marmoset V1 (from Fritsches and Rosa, 1996). In these maps, isoeccentricity lines are indicated by thin dotted lines, and isopolar lines are indicated by thin continuous lines.

