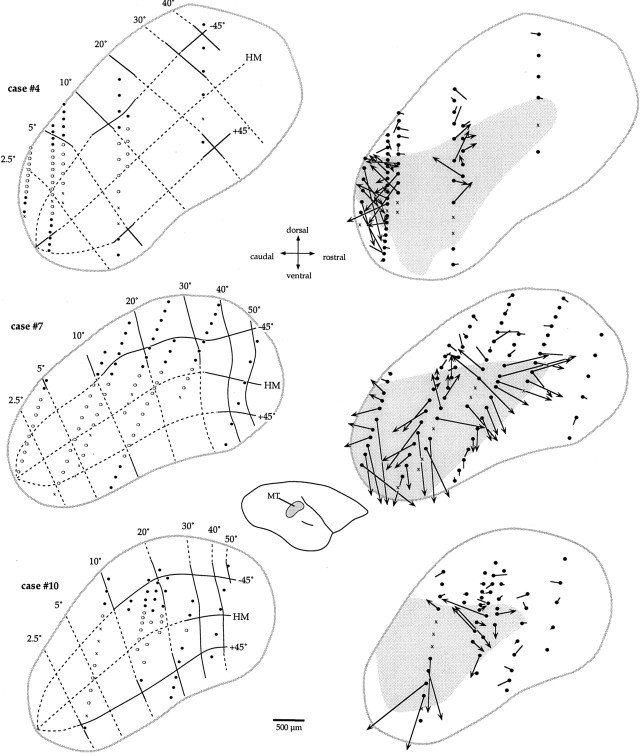
Fig. 7.
Left, Estimates of the “normal” (prelesion) visuotopic organization of MT in three animals. The estimated locations of isoeccentricity and isopolar lines are shown, based on the averaged map of MT in six normal animals. The recording sites shown as black circles were used as a guide in regions outside the lesion projection zones. The dashed lines are estimates only. Right, Arrow diagrams indicating the displacement of visuotopic coordinates for individual recording sites. In these diagrams, the extent of the lesion projection zones is shown in gray. For cells within the lesion projection zones, an arrow connects the location of the recording site (circle) to the point of the estimated prelesion map corresponding to the location of the receptive field center. An arrow terminating outside the map indicates a receptive field center in the ipsilateral hemifield. For cells outside the lesion projection zones, this is indicated by aline segmentwithout an arrowhead. Thecrosses indicate the location of nonresponsive neurons. In view of the density of recordings in the central representation ofcase #4, for clarity some recording sites are not included in the arrow diagram (top right).

