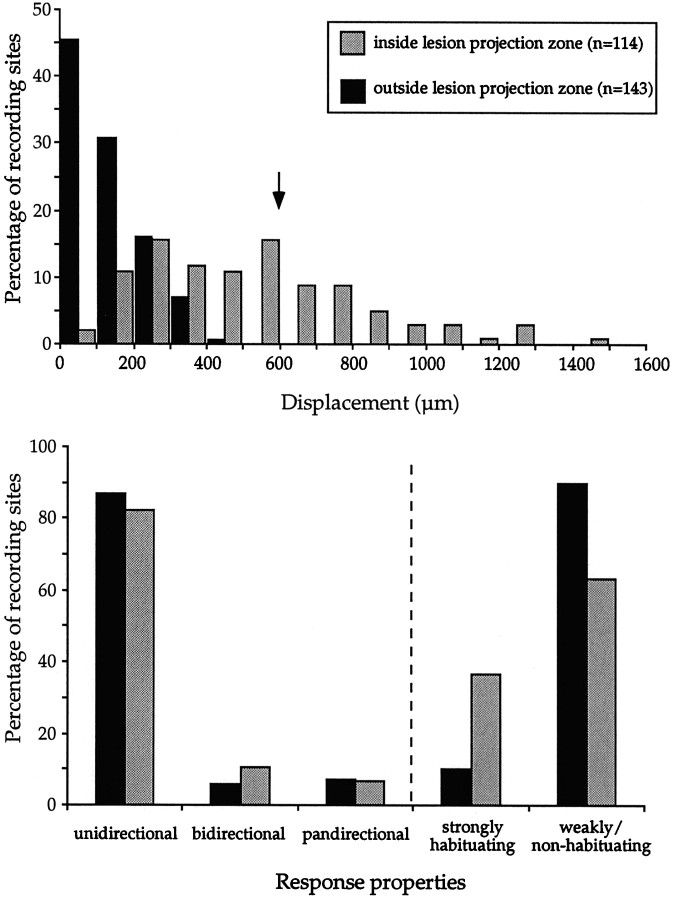
Fig. 8.
Top, Extent of visuotopic “reorganization” within and outside the lesion projection zones, estimated as illustrated in Figure 7. For sites outside the lesion projection zone (black bars), this indicates the error in estimate attributable to sparse sampling and the normal receptive field scatter. The radius of the point-image size (mean + 2 SD) in normal marmoset MT is indicated by the arrow.Bottom, Percentages of neurons with different functional characteristics in terms of direction selectivity (left) and habituation (right).

