
Fig. 2.
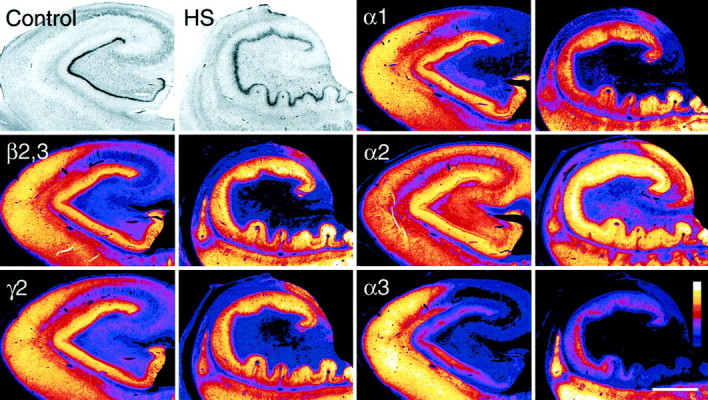
Cytoarchitecture and regional distribution of the major GABAA receptor subunits in the hippocampus from a control (autopsy, first and third columns) and a TLE patient with HS (second andfourth columns). Optical density of staining is color-coded according to a normalized scale showing the strongest signal in white and the background in dark blue. In both specimens, adjacent sections were stained for the subunits α1, α2, α3, β2,3, and γ2, and for Nissl. In the control, Nissl staining shows a normal distribution of neuronal cell somata. Labeling for the β2,3- and γ2-subunits is largely similar, whereas each α-subunit has a differential distribution pattern. In TLE with HS, Nissl staining reveals prominent cell loss in CA1, CA3, and dentate hilus with relative sparing of the dentate granule cell layer and granule cell dispersion. The CA2 and partly CA3 pyramidal cell layer is not shown in this section, but is visible in those stained for the α-subunits. The decrease in GABAAreceptor subunit immunoreactivity parallels cell loss in CA1, CA3, and dentate hilus, whereas staining is increased or decreased in a subunit-specific manner in CA2 and dentate gyrus. Themagenta spots in the dentate hilus represent surviving mossy cells. Scale bar, 2 mm.