
Fig. 1.
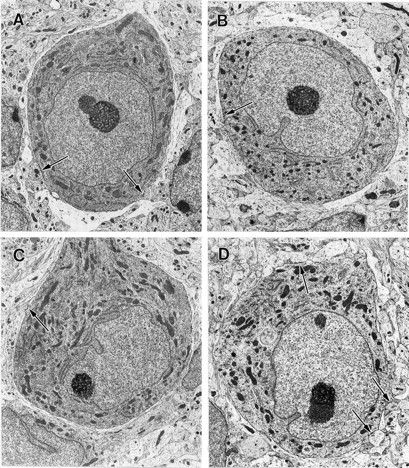
Electron micrographs of Purkinje cell soma profiles from control, activity-blocked, and neurotrophin-treated activity-blocked newborn mouse-derived organotypic cerebellar cultures at 15 DIV. All cells are shown at the same magnification (3150×). Thearrows indicate axosomatic synapse profiles. Astrocytic sheaths are evident as relatively clear areas around the circumferences of the cells. A, Purkinje cell from a control culture maintained in standard nutrient medium. B, Purkinje cell from a cerebellar explant continuously exposed to activity-blocking agents, 10−8m TTX and 11.1 mm Mg2+, incorporated into the nutrient medium. C, Purkinje neuron from a cerebellar culture exposed since explantation to nutrient medium with incorporated activity-blocking agents and 25 ng/ml NT-3. D, Purkinje cell from a cerebellar explant continuously exposed to activity-blocking agents and 25 ng/ml NT-4. There are no significant differences in the morphology of the cells other than the ratios of axosomatic synapse to soma profiles, which are reduced in activity-blocked cultures and activity-blocked cultures treated with NT-3, and at control levels in activity-blocked explants treated with TrkB receptor ligands (Table 1).