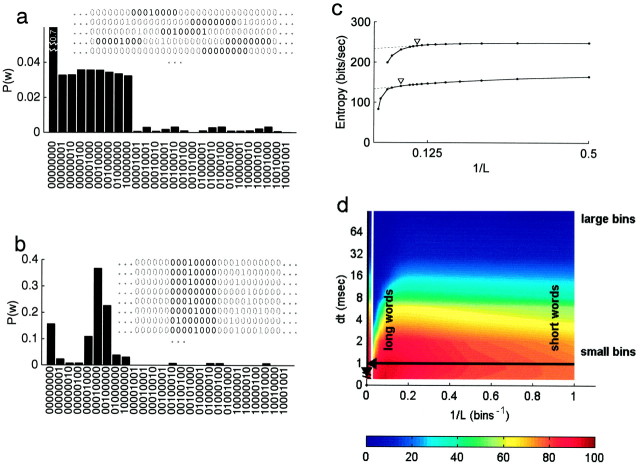
Fig. 2.
Illustration of calculation of mutual information. Data are same as shown in Figure 1. a, Probability distribution of words of length L = 8, binned at δτ = 1, for the calculation ofHtotal.P(w) for w = 00000000 is far off scale (0.70). Although 28patterns were possible, only 26 actually occurred (n = 31776). Inset, Samples from five responses to nonrepeated stimuli (Fig. 1a,unique). Several eight bin words are highlighted.b, Probability distribution of words of lengthL = 8, binned at δτ = 1, for the calculation of Hnoise at one particular word position. Over 128 repeats, only 13 patterns were observed at this position of the 26 patterns observed for the entire stimulus ensemble (a). Inset, Samples from eight of the 128 responses to the repeated stimulus (Fig. 1a,repeat). A particular eight bin word is highlighted, which corresponds to a fixed time in the repeated stimulus.c, Estimated entropy rate of the responses,H (Eq. 2), is plotted against the reciprocal of word length, 1/L. Note that longer words are to theleft in this plot. BothHtotal (top) andHnoise (bottom) decrease gradually with increasing L, as expected if there are any correlations between bins. For very long words,Hnoise and Htotalfall off catastrophically, which indicates that there are not enough data for the calculation beyond this point. Dashed linesshow the extrapolations from the linear part of these curves to infinitely long words (lim L → ∞), as described by Strong et al. (1998). The point of least fractional change in slope was used as the maximum word length L(arrows) used for extrapolations. Mutual informationI is the difference between these two curves (Eq. 1).d, Parameter space of the calculation. Iis estimated over a range of L (plotted as 1/L, horizontal axis) and a range of δτ (vertical axis). The resulting estimate I(L, δτ) obtained with different parameter values is indicated bycolor (interpolated from discrete samples). Values to the left of the gap reflect extrapolations to infinite word length (lim L → ∞, i.e., 1/L → 0). Arrows indicate slices through parameter space:L = ∞ (vertical arrow, replotted in Fig. 3) and δτ = 1 (horizontal arrow, replotted in Fig. 4). Point at origin indicates the true information rate, which is obtained in the limit L → ∞ at sufficiently small δτ. (With finite data, the estimate is not well behaved in the limit of δτ = 0).

