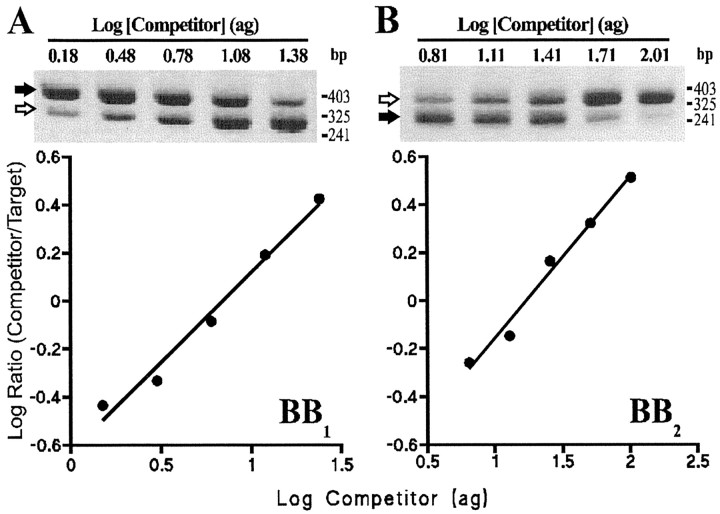
Fig. 8.
An example of competitive RT-PCR for the BB1 (A) and the BB2(B) receptor. Top, Gel images showing authentic BB1 and BB2 receptor target (filled arrows) and competitor (open arrows). The amount of competitor (attogram) added at the start of the reaction is indicated above each lane. Molecular weight markers are indicated (HpaII digest of pBluescript SK+).Bottom, The density of target and competitor bands on the gels (arbitrary units) were measured and corrected for the difference in size, and the log ratio was calculated and plotted as a function of the amount of competitor DNA included at the start of the PCR reaction. From the regression lines shown, the amount of BB1 and BB2 receptor cDNA present in the reaction was calculated (i.e., when log ratio target/competitor = 0). For BB1 r2 = 0.981, p = 0.001; for BB2r2 = 0.983,p = 0.0009.

