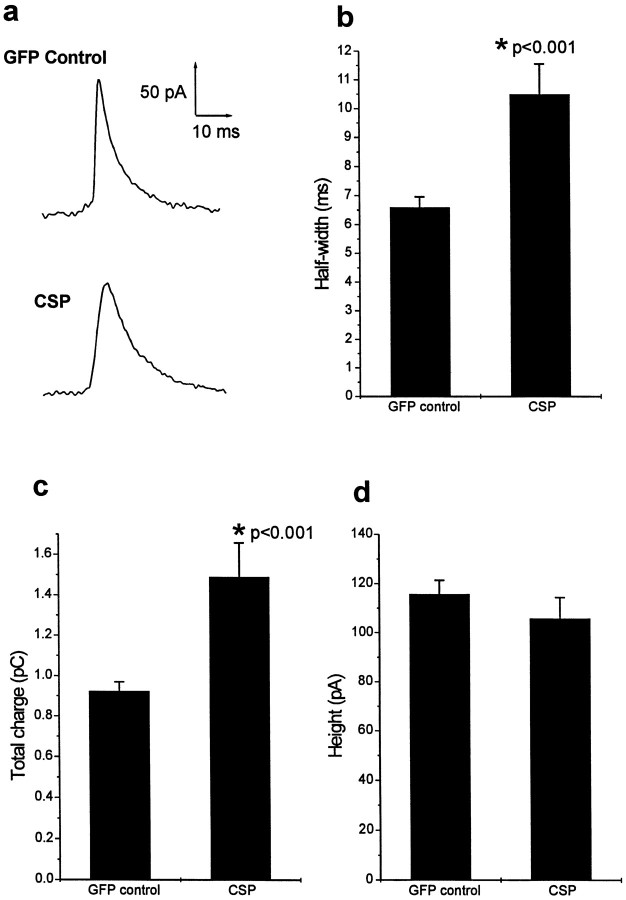
Fig. 6.
Analysis of amperometric spikes from control and Csp-transfected cells. a, Example spikes representing the average spikes in control GFP-expressing cells and Csp-transfected cells on an expanded time base. Mean values of the half-width of the spikes (b), the total carried per spike (c), and the mean value for peak spike height (d) are shown for control (n= 302 spikes) and Csp-transfected (n = 64 spikes). Data are shown as mean ± SEM.

