
Fig. 6.
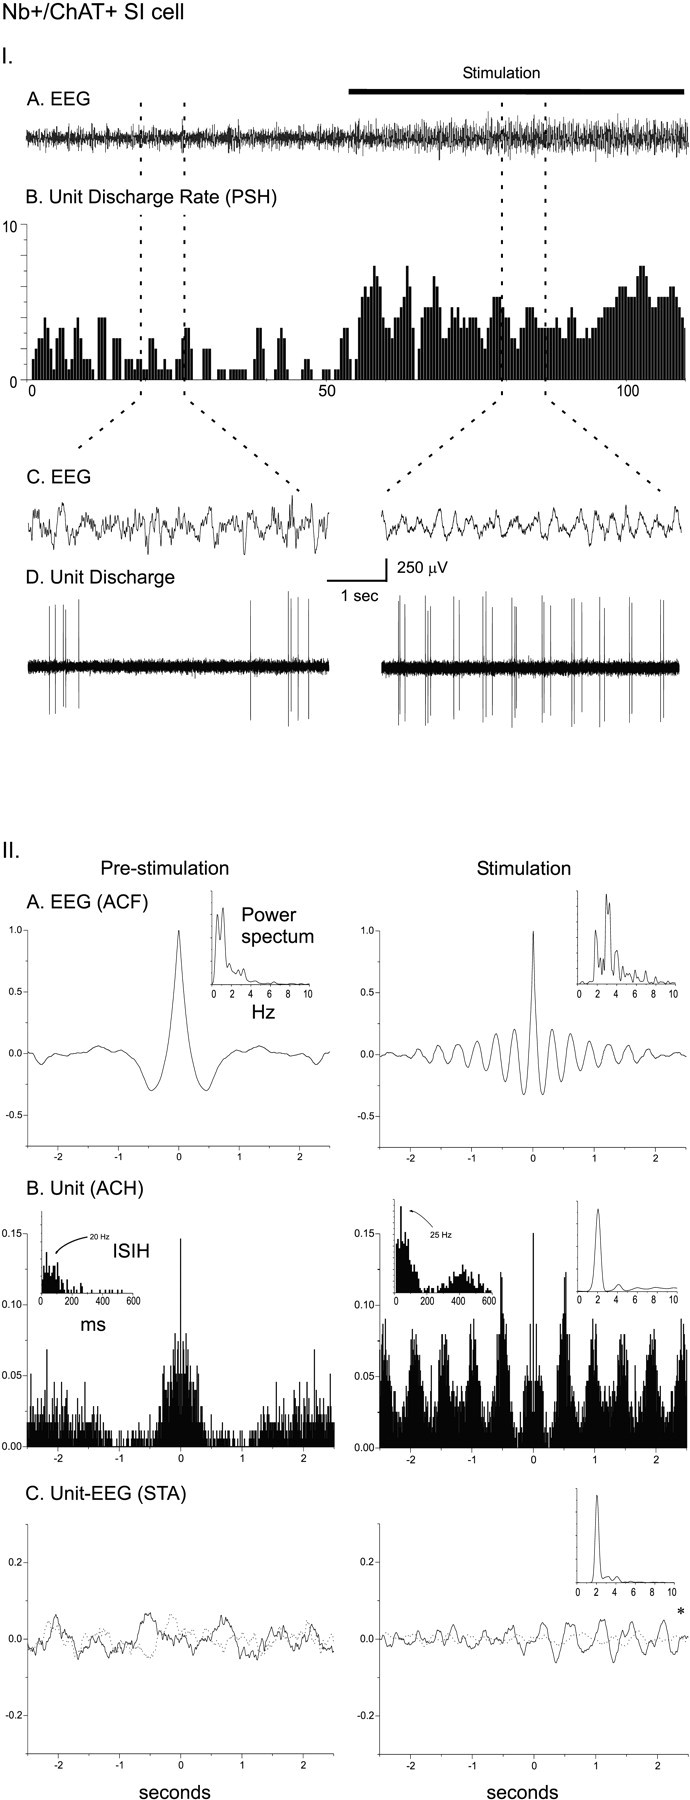
I. Discharge pattern of Nb+/ChAT+ neuron (#98812009/10) in the SI (see Fig. 3B). A, EEG (from retrosplenial cortex) and (B) peristimulus histogram (PSH) of the mean rate of discharge (in spikes per sec) before and during stimulation of the animal.C, EEG and (D) unit discharge traces are expanded for both prestimulation and stimulation conditions (left and right). Note the change from an irregular discharge pattern to a rhythmic burst-like discharge pattern in addition to the increased rate of discharge and in association with a change in EEG activity with stimulation. II. EEG and unit analysis during prestimulation and stimulation conditions. A, Autocorrelation functions (ACF; with correlation coefficients on vertical axes) of the prestimulation and stimulation EEG recordings and corresponding power spectra. B, Autocorrelation histograms (ACH; with correlation coefficients on vertical axes) of prestimulation and stimulation unit spike trains and insets of corresponding interspike interval histograms (ISIH). A power spectrum is shown (inset) for the stimulation ACH in which rhythmic activity is apparent. C, Spike-triggered averages (STA) of unit–EEG cross-correlation (with mV on vertical axes) for actual unit (black line) and randomized spike train (gray line). A power spectrum is shown (inset) for the stimulation STA in which the actual unit–EEG function was significantly different from the randomized spike train unit–EEG function (Wilcoxon test; *p < 0.05). Note with stimulation the appearance of cross-correlated EEG and unit rhythmic activity with a peak frequency of ∼2 Hz, which did not correspond to the prominent EEG rhythmic slow activity or spectral peak but did correspond to a secondary peak in the EEG power spectrum.