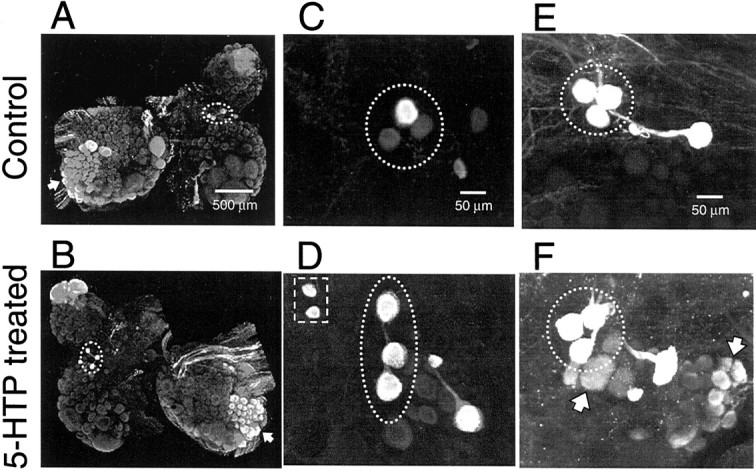
Fig. 2.

5-HTP treatment increased the intensity of 5-HT immunofluorescence in Tritonia. The DSIs arecircled in each image. Note that the relative orientation of the three DSIs is somewhat variable from animal to animal and even different among contralateral homologs.A, C, E, Untreated control preparations.B, D, F, Preparations treated with 5-HTP (2 mm, 60 min, 1 d before fixation). A, B, Comparison of 5-HT staining in the two halves of the same brain. Only the right half (B) received the 5-HTP treatment, which increased the intensity of labeling in all serotonergic cells. In this illustration, the effect of 5-HTP is most apparent in the DSIs (circled), the giant serotonin cerebral cell C1 (top of image), and the posteriolateral group of pedal neurons (large groups of cells indicated byarrow). C, D, 5-HTP treatment increased the intensity of staining in the DSIs and caused the appearance of 5-HT immunoreactivity in a pair of neurons lateral to the DSIs (D, square). Note the variable level of DSI staining in the control preparation (C). The 5-HT immunofluorescence is also increased in the two medial (to the right) serotonergic cells, previously identified by Sudlow et al. (1998). The preparations shown in A–D were processed with 5-HT antiserum at 1:10,000 dilution. For illustration purposes, the paired images,A and B and C andD, were contrast-enhanced to the same degree within each pair, to accentuate the effects of 5-HTP treatment on 5-HT immunofluorescence. E, F, Treatment with 5-HTP increased the number of neurons displaying low levels 5-HT immunoreactivity (F, arrows). To increase the sensitivity of the staining procedure, the antiserum dilution was decreased to 1:1000, and the amplifier gain of the photodetectors was increased, resulting in a saturation of normal 5-HT staining in the DSIs (circled). Images C–F are from left cerebropleural ganglia.
