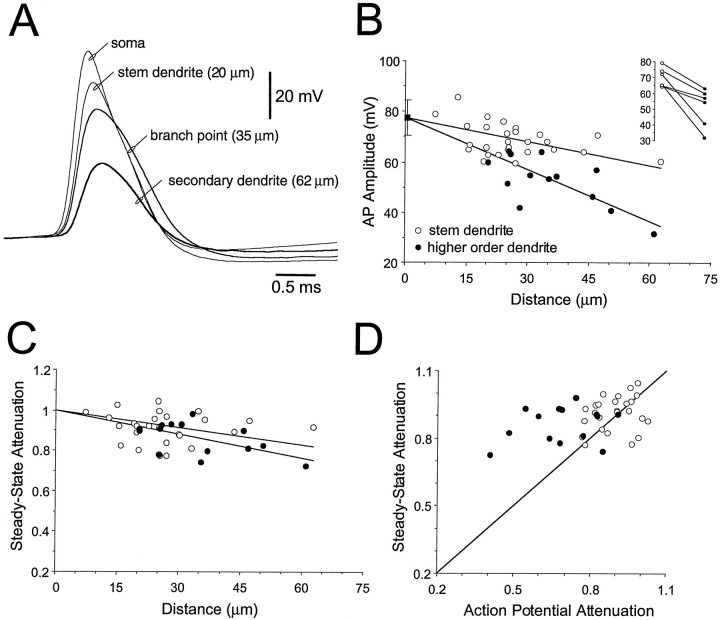
Fig. 2.
Action potential backpropagation into the dendrites of TC neurons. A, Simultaneous somatic and dendritic recordings of action potentials evoked by somatic current injection. Dendritic recordings were sequentially made from the first branch point of a stem dendrite (35 μm from the soma/dendrite intersection), from the stem dendrite (20 μm), and from one of its daughter dendrites (62 μm). Note changes in action potential onset, the abrupt decrease in amplitude, and increase in action potential duration for recordings made at and after the dendritic branch point.B, Pooled data demonstrate the relationship between action potential amplitude and dendritic recording location for recordings made from stem (○) and higher order (●) dendrites. All data from simultaneous somatic and dendritic recordings. The average amplitude of somatic action potentials (±SD) is shown as thefilled square. Lines represent regression analysis, constrained to the average somatic action potential amplitude. The inset shows the degree of reduction of action potential amplitude for recordings made before (○) and after (●) a branch point from the same dendrite. C, Normalized steady-state attenuation of small negative voltage responses evoked at the soma for recordings made from stem (○) and higher order dendrites (●). Lines represent regression analysis, constrained at origin to 1. D, Relationship between normalized steady-state attenuation and normalized action potential attenuation for recordings made from stem (○) and higher order dendrites (●); the line has a slope of 1.

