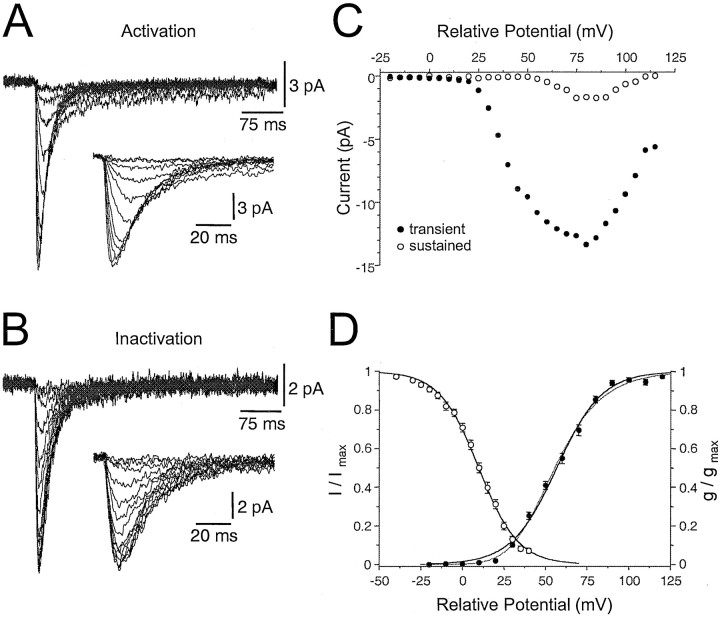
Fig. 8.
Steady-state properties of low-threshold calcium channels. A, Superposed cell-attached current traces used for the construction of steady-state activation curves during test pulses from +15 to +65 mV in 5 mV steps. Each trace is an average of five trials. The inset shows the voltage-dependent activation kinetics of the current at a faster time base.B, A family of current traces used for the construction of steady-state inactivation curves during prepulses from −40 to 40 mV in 10 mV steps. The insets show the voltage-dependent kinetics of this current at a faster time base. C, Current–voltage relationship of the current shown in Awhen measured at peak amplitude (●) or immediately before the termination of the test pulse (○). D, Pooled steady-state activation (●) and inactivation (○) curves; each point represents mean ± SEM. The solid curves were fit with single Boltzmann functions (see Material and Methods). A better approximation of the activation curve was found by raising the Boltzmann function to the third power (dashed line). Note the voltage overlap between curves. Voltages are relative to resting membrane potential.

