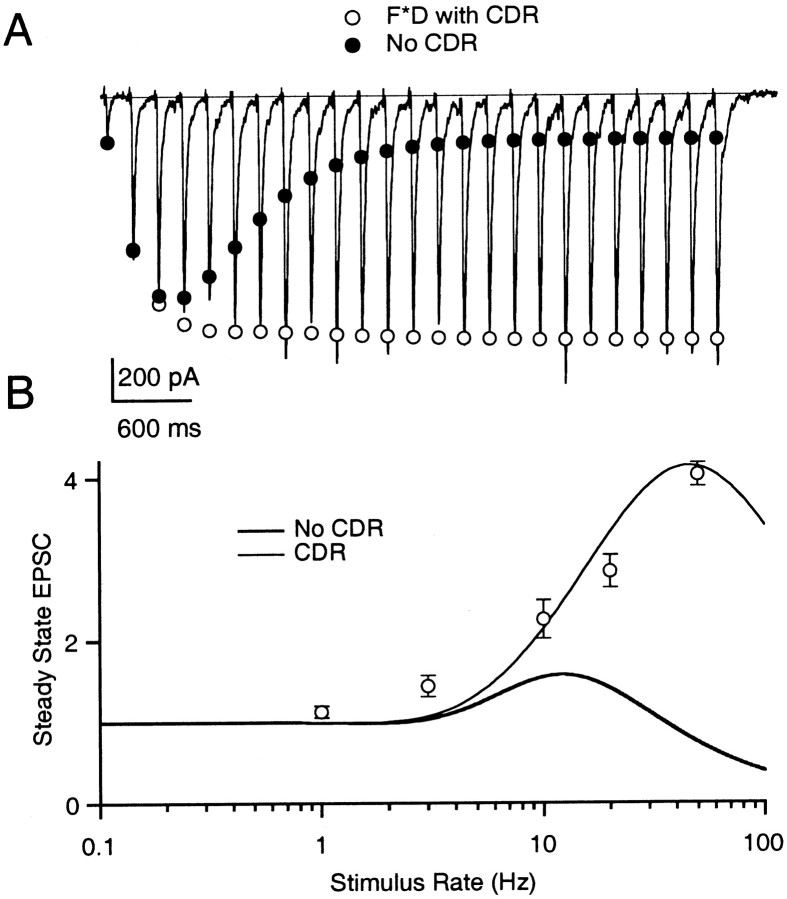
Fig. 6.
Importance of CDR at “low P” synapses. A, Parallel fiber to Purkinje cell EPSCs recorded during 25 stimuli at 50 Hz. Trace represents a single trial. Open circles are the predicted FD model EPSC magnitudes using Equation19. Filled circles represent the same FD model without CDR (CaXD = 0). B, Steady-state EPSC size plotted against stimulus frequency for the parallel fiber synapse with (thin line) and without (thick line) CDR.Open circles are parallel fiber data from Figure 2B. Model parameters were ρ = 3.8, F1 = 0.038, τF = 100 msec, τD = 50 msec, kmax= 30 sec−1, ko = 2 sec−1, KD = 2.

