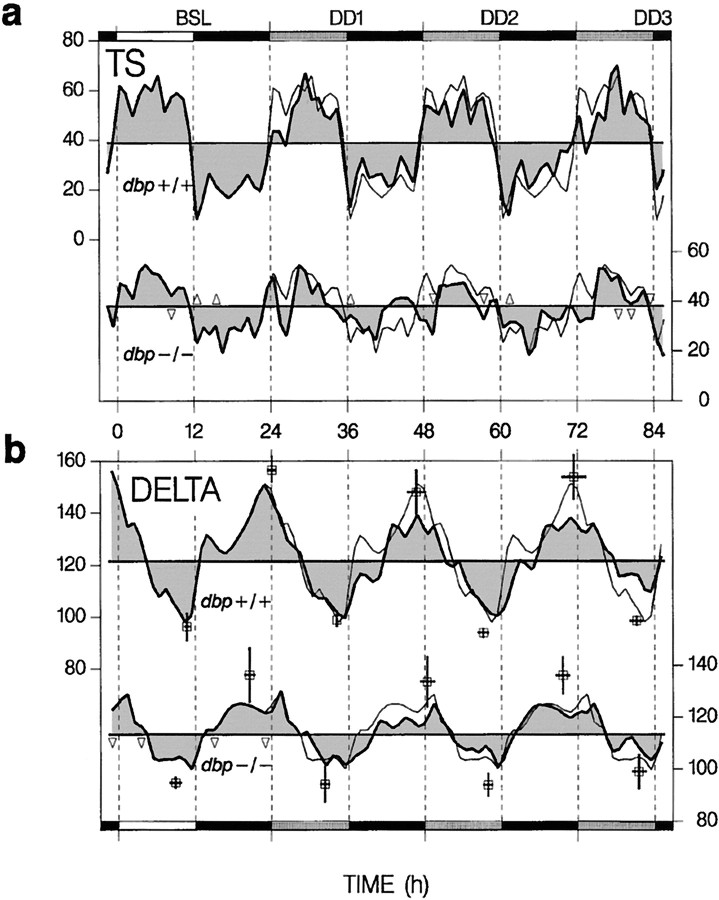
Fig. 3.
Time course of TS and SWS EEG delta power (DELTA) for a BSL under 12 hr light/dark, followed by 2.6 d under constant darkness (DD1–DD3). Top curvein each panel represents dbp+/+ (leftscaling), and the bottom curve representsdbp−/− (right scaling). Thin lines are repetitions of BSL. Δ > dbp+/+ and ▿ < dbp+/+ indicate intervals in which values differed between genotypes (p < 0.05;t tests; n = 4 per genotype).Black horizontal bars indicate dark periods, andshaded bars indicate the subjective light periods under DD. a, Hourly TS values as percentage recording time. Horizontal lines represent the mean TS in BSL, DD1–DD3. b, Hourly or 2 hr delta values for the (subjective) light or dark periods, respectively, as a percentage of the value in the last SWS hour in the BSL light period. Thick horizontal lines represent the mean level of DELTA in BSL, DD1–DD3. Peak and trough values are indicated by open squares (±SEM for time and magnitude). Only peak values and amplitude (peak − trough) varied with genotype [two-way ANOVA; factor genotype (amplitude, peak), p < 0.03; factor day,p > 0.6]. The difference between peak or trough times of consecutive days did not deviate from 24 hr (pairedt tests).

