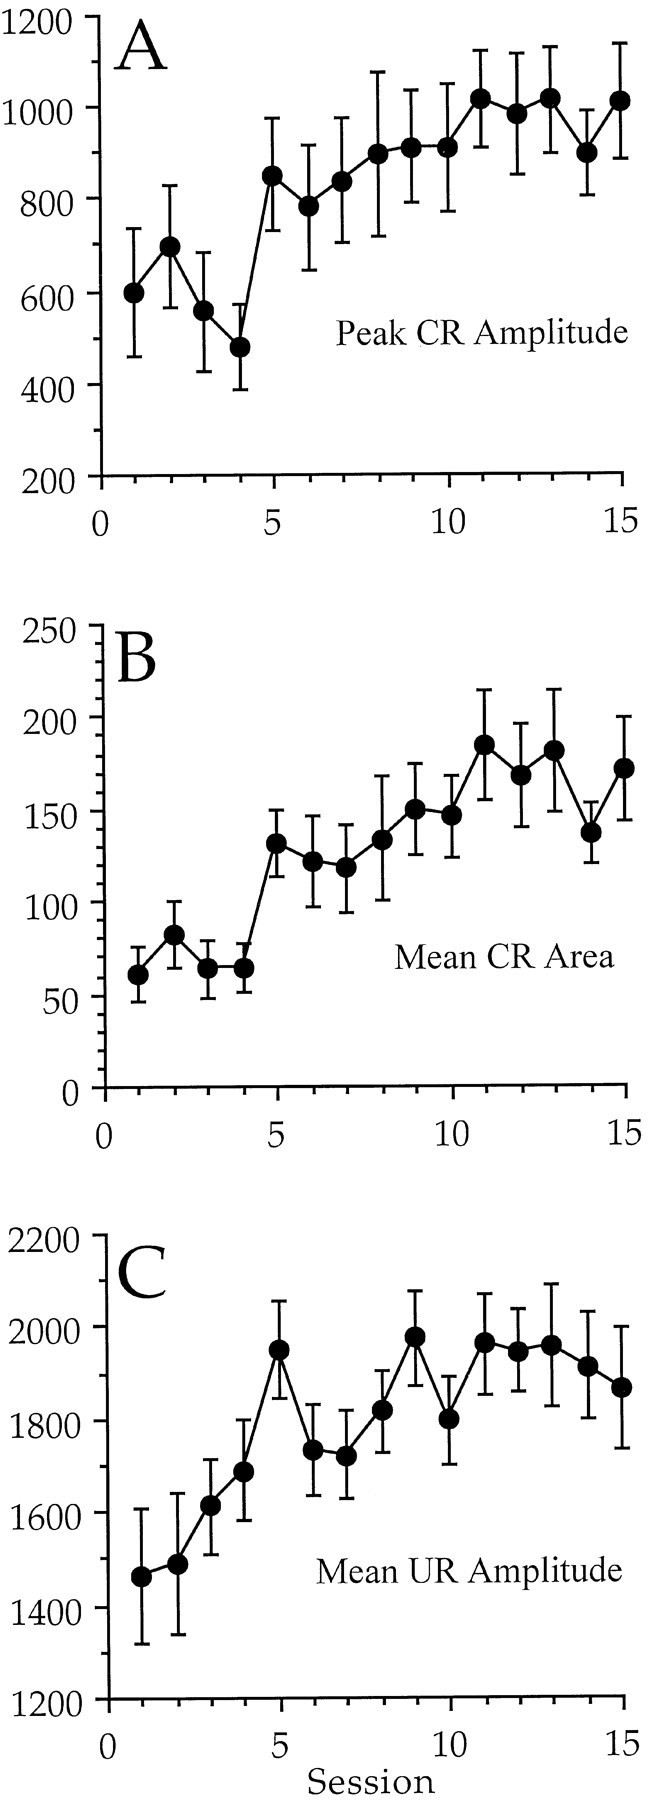
Fig. 2.

A, A graph of the peak amplitude of response during the CS–US period on trials in which there was a CR.B, A graph of the area of response during the CS–US interval on trials in which there was a CR. C, A graph of the mean amplitude of response during the UR period. There was a significant increase in all three measures across sessions, but no significant differences among the groups and no significant interaction of dose and session were found. A comparison of these data with those in Figure 1 indicate that the high-dose rabbits showed more CRs, rather than CRs with different characteristics. The y-axis is shown in integrated units.
