Fig. 6.
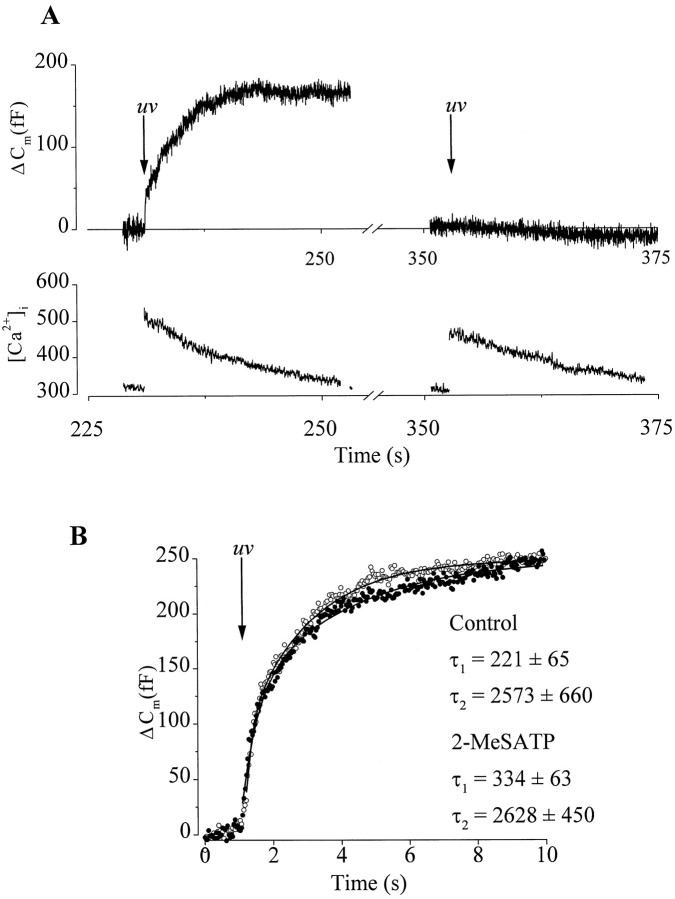
P2Y receptor activation did not modulate secretion evoked by flash photolysis of caged Ca2+. A, Cm traces (top trace) and corresponding [Ca2+]i (bottom trace) recorded in response to the first flash (80 J, 500 μsec) given ∼240 sec after establishing the whole-cell configuration (left panel) and a second flash of the same intensity given 120 sec later to the same cell (right panel).B, Kinetic analysis of two example ΔCm recorded in response to the first flash after establishing the whole-cell configuration, either under control conditions (○) or in the presence of 100 nm2-MeSATP (●). For clarity of illustration, only every third point is shown. The solid line drawn through the data represents a double-exponential fit obtained using theCm point immediately after the UV flash and the plateau level as limits. The mean time constants displayed are for both control conditions (n = 5) and in the presence of 100 nm 2-MeSATP (n = 4).

