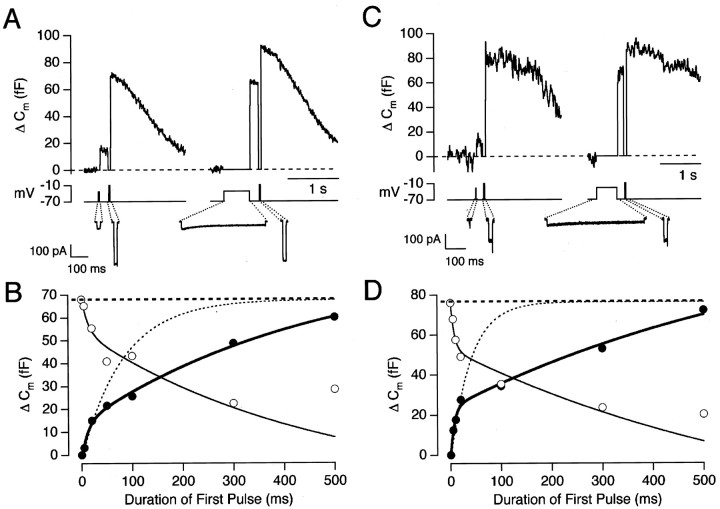
Fig. 1.
Exocytosis evoked by Ca2+currents. A, Capacitance responses evoked by pairs of depolarizing stimuli. The first stimulus, to −33 mV, had a duration of 20 msec in the left trace and 500 msec in theright trace. In each case, the second stimulus was a 20 msec depolarization to −10 mV, delivered after a delay of 200 msec (the emptying stimulus; see Results). The leak-subtracted Ca2+ currents evoked by each stimulus are shown below on an expanded time scale. B, The filled circles plot the size of the capacitance increase as a function of the duration of the depolarization to −33 mV (same cell as inA). The bold line through thepoints is an empirical fit of a double-exponential function, with 14 fF of the capacitance increase occurring with a rate-constant of 77 sec−1 and 70 fF with a rate-constant of 2 sec−1. The total size of the RRP at the beginning of each stimulus episode, calculated from the summed responses to the shorter stimuli, averaged 68 fF (heavy dashed line). The light dashed line shows the time course of exocytosis that would be predicted if the RRP were exocytosed with a fixed rate-constant of 12 sec−1. Theopen circles plot the capacitance response elicited by the emptying stimulus. The thin line is a mirror image of the bold line. C, Capacitance responses evoked by depolarizations to −28 mV lasting 5 msec (left trace) and 500 msec (right trace). In each case, an emptying stimulus was delivered 200 msec later.D, The time course of exocytosis (filled circles) and decline in the size of the RRP (open circles) at a membrane potential of −28 mV (same cell as inC). The size of the RRP at the beginning of each stimulus episode averaged 76 fF (heavy dashed line), which is equivalent to 2900 vesicles. The light dashed line shows the time course of exocytosis that would be predicted if the RRP were exocytosed with a fixed rate-constant of 27 sec−1. The fit to the filled circles(bold trace) is a double-exponential function with 24 fF occurring with a rate-constant of 140 sec−1 and 91 fF with a rate-constant of 1.4 sec−1. Thethin line describing the decline in the size of the RRP is a mirror image of the bold line.

