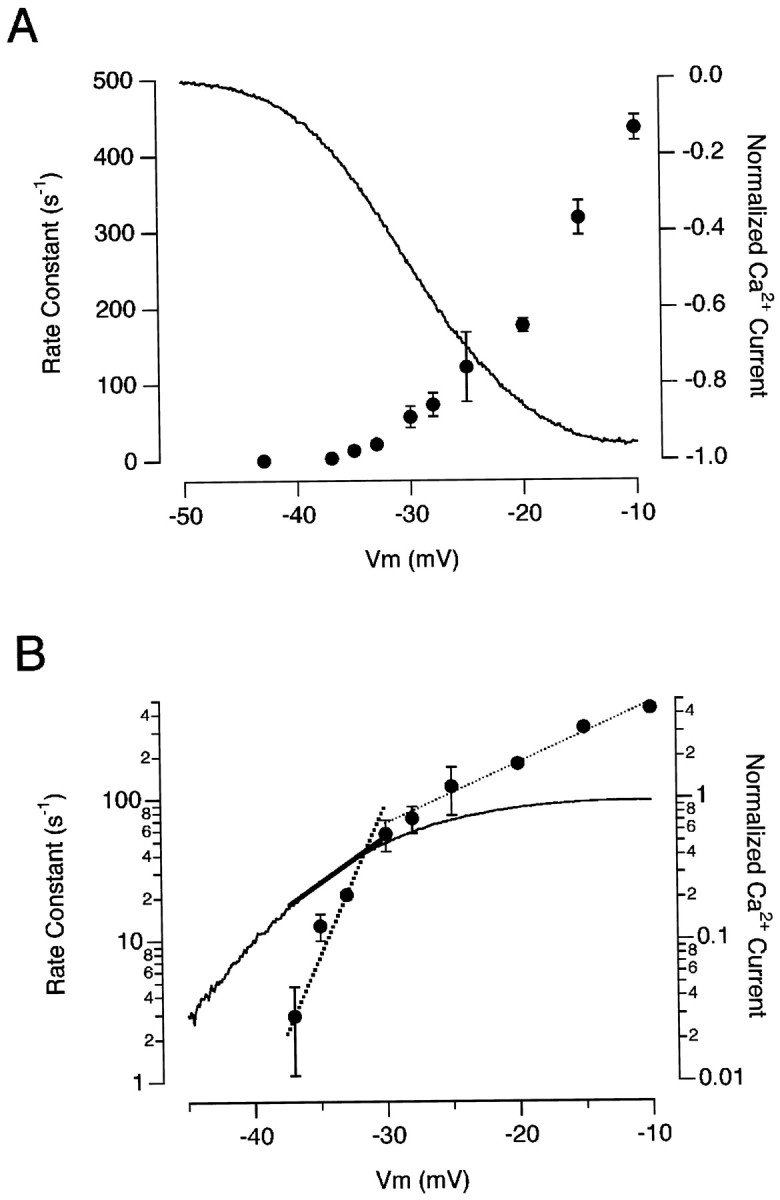
Fig. 7.

The voltage-dependence of rapid exocytosis.A, The initial rate-constant of exocytosis plotted as a function of the membrane voltage (right axis). For membrane potentials ranging from −37 to −33 mV, the initial rate of exocytosis was calculated using a stimulus lasting 20 msec that released <50% of the RRP. For membrane potentials from −30 to −25 mV, measurements were made using a stimulus lasting 2 msec that released <50% of the RRP. For stronger depolarizations, the rate-constant of exocytosis was calculated from single-exponential fits to the time course of the capacitance increase, as in Figure6D. Each point is the average of measurements on four to eight terminals. The continuous line shows the voltage-dependence of the Ca2+ current, normalized to its maximum. The measurement was made using a ramp change in membrane potential (see Materials and Methods) and is an average from 10 detached terminals.B, The results in A plotted semilogarithmically. The rate-constant of exocytosis changed e-fold in 2.1 mV at membrane potentials below −30 mV (bold dotted line), whereas the Ca2+ current changed e-fold in 6.6 mV over the same range (bold line). Between −30 and −10 mV, the rate-constant of exocytosis changed e-fold in every 10 mV (thin dotted line).
