
Fig. 8.
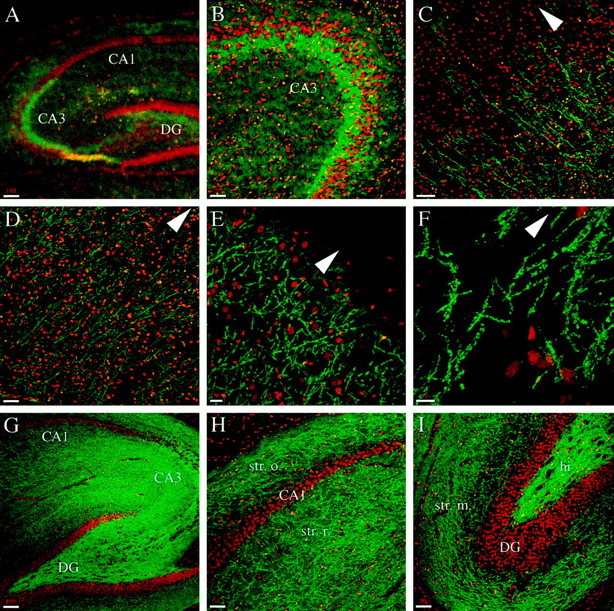
The distribution of phosphorylated syntaxin 1 changes in the cortex and hippocampal region during development. All of the panels represent confocal images of rat brain sagittal sections double-labeled with αPsyn (green) and TOTO-3 (red). A, B, In P9 animals the CA3 region of the hippocampus shows enriched presence of psyn1A/B. C, In the cortex of P9 animals, the psy1A/B-positive axons are found in the inner layers, but the staining does not extend to the pial surface. D–F, In adult animals the cortex shows αPsyn-stained axons throughout its layers (D, F), all the way up to the pia (E). G–I, The hippocampus of adult animals is intensely stained with αPsyn (G). In the CA1 region (H), numerous axons are observed in the stratum oriens and stratum radiatum. The dentate gyrus (I) shows intense staining in the hilus and high density of labeled axons in the stratum moleculare. CA1, CA1 region of the hippocampus; CA3, CA3 region of the hippocampus; DG, dentate gyrus; hi, hilus;str. m., stratum moleculare; str. o., stratum oriens; str. r., stratum radiatum. The pia is up in the direction of the arrowhead. Scale bars: A,G, 100 μm; B, D, H,I, 50 μm; C, E, 20 μm;F, 10 μm.