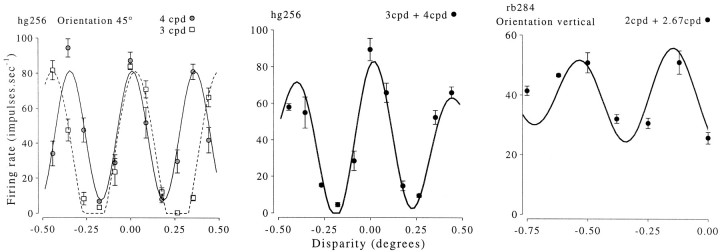
Fig. 11.
Effects of stimulating two disparity selective neurons with compound gratings. Left graph, Responses of one neuron to the two component gratings presented individually. The fitted curves are sinusoids in which the spatial period is fixed at the horizontal period of the stimulus. Center graph, Responses of the same cell to a stimulus that was the sum of the two stimuli in the left graph. The fitted curve shows a weighted linear sum of the two sinusoids fitted to the data in the left graphand accounts for 85% of the variance induced by disparity. Right graph, Responses to the compound grating of the cell for which the fitted curve was the worst in the data set. Despite this, the data are qualitatively similar to those in the center graph. There is a second peak in the tuning curve, which is smaller and broader than the peak near 0 disparity.

