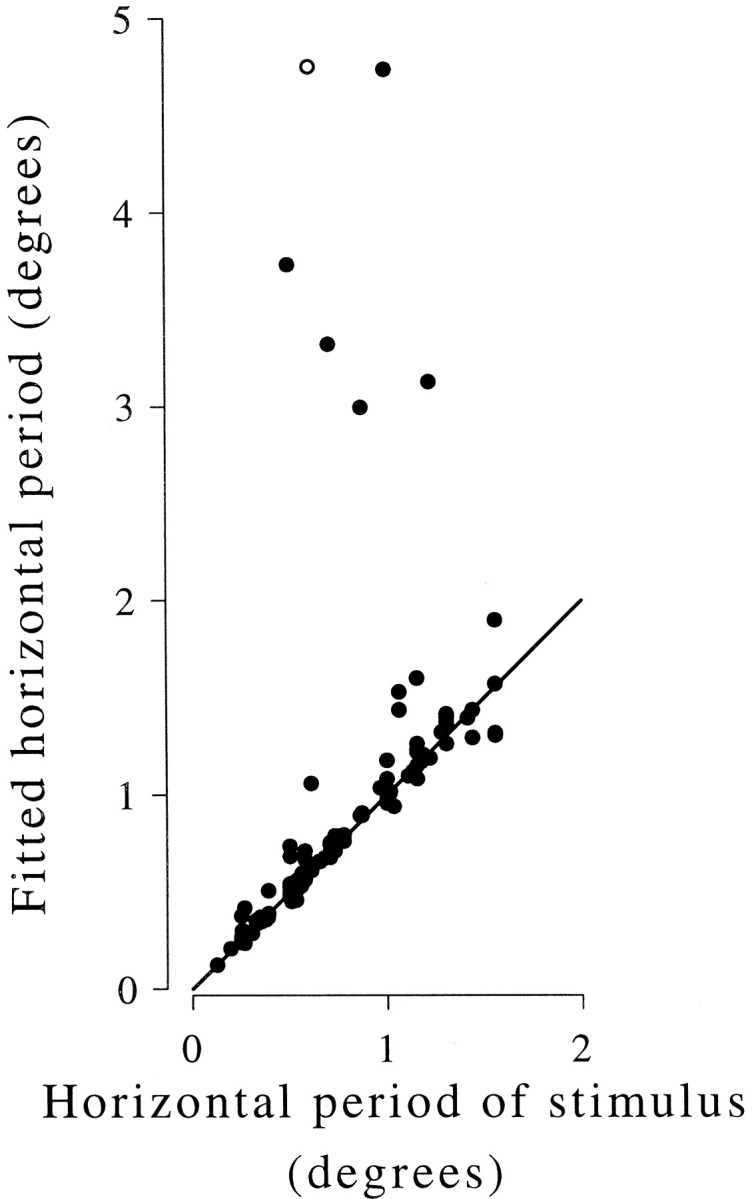
Fig. 6.

Disparity modulation is sinusoidal with the spatial period predicted by local matching. The period of the best fitting sinusoid is plotted against the horizontal spatial period of the stimulus. Results of 129 experiments are plotted from 117 neurons. Responses were measured at two spatial frequencies in 12 neurons. Most neurons show a close agreement between the expected and observed spatial period (solid line). Small deviations above this line could be the result of vergence eye movements (see Results). The open symbol shows the most extreme deviation (hg186), for which the tuning curve is shown in Figure8.
