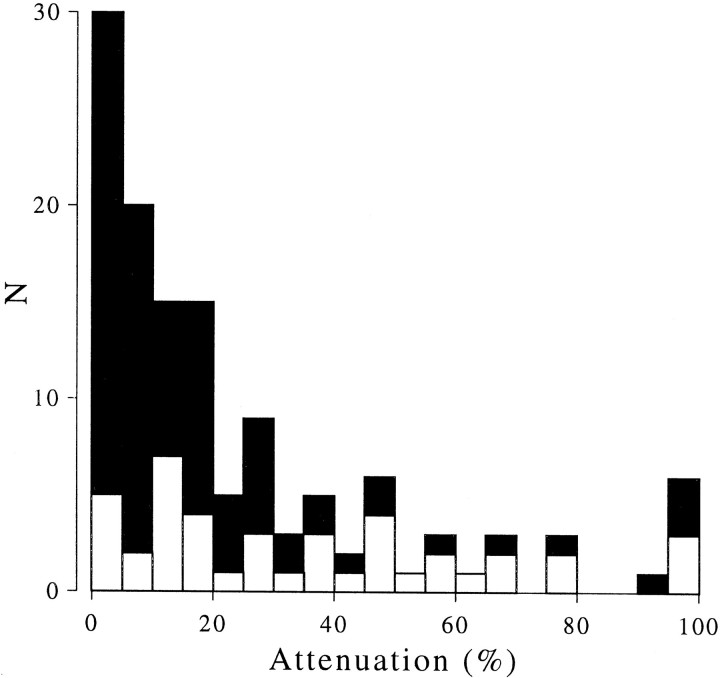
Fig. 7.
Frequency distribution of response attenuation. This compares the response at the peak of the Gabor with the response to a stimulus differing in disparity by exactly one period of the stimulus. This is expressed as a percentage attenuation relative to the peak response. There is a large clustering of neurons in the region of zero attenuation. Note that attenuation is always calculated relative to the peak of the fitted Gabor, even though this peak could have occurred in response to a false match. Indeed comparison with the responses to RDS stimuli suggested that for many cells the largest peak was in response to a false match. Solid symbols show the data for strongly disparity-selective neurons (maximum response >20 spikes/sec and maximum response > twice minimum response). Open symbols show the remaining data.

