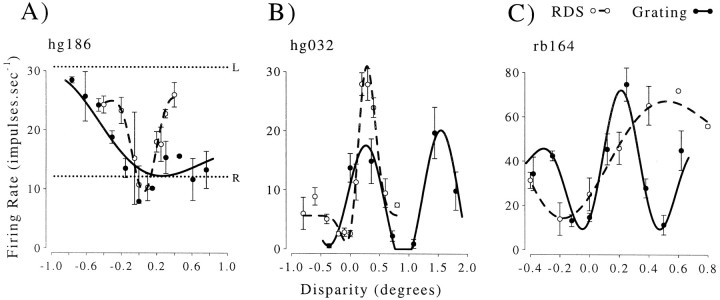
Fig. 8.
Responses of three neurons illustrating extreme deviations from simple sinusoidal tuning functions. In all three cases, the attenuation is much larger than the median of the population (14%), so these represent extreme examples. Nonetheless, when the responses to RDS are considered, it is hard to reconcile any of these cases with a specific selectivity for global matches. In each case, thesolid line shows the Gabor fit to the disparity tuning measured with gratings (solid symbols), and the dashed line shows a Gabor function fit to the disparity tuning measured with RDS (open symbols). A, Most extreme deviation observed in the entire data set (100% attenuation). The repeat period of the grating tuning curve is much larger than the stimulus period (ratio 7.8, shown with an open symbol in Fig. 6). The pattern of disparity selectivity for gratings is quite different from that observed in response to RDS. Note that the response to large positive disparities is similar to that for right eye monocular stimulation (dashed line), as if the grating patch no longer covered the RF in the left eye. B, Example in which the tuning function shows the expected periodicity but shows changes in the depth of modulation (27% attenuation). Note that the greatest firing rate is in response to a false match (assuming that the response to RDS indicates the global match normally signaled by this neuron). C, Example in which responses on either side of the central peak are attenuated (43%), yet once again the value of the preferred disparity is different from that shown in response to RDS. The pattern seen in response to the grating could occur if the area of binocular overlap in the stimulus no longer covers the neuron's binocular summation area. In all three cases shown here, the comparison of responses to gratings and RDS does not support the view that these neurons fire selectively for global stereoscopic matches.

