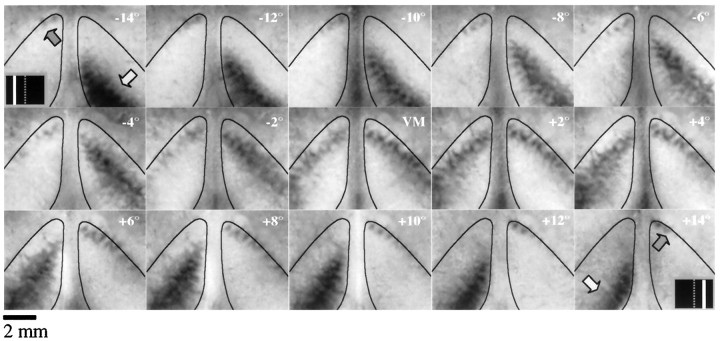
Fig. 3.
Cortical response to a 0.5° wide bar stimulus placed in a series of 15 positions from 14° left of the VM (−14°) to 14° right of the VM (+14°), spaced at 2° intervals (animal TS9762). The thin black lines in each frame outline V1 as determined by the limits of the area of strong orientation selectivity. Dark areas indicating stimulus-driven cortical activation are seen bilaterally in each image. In the first and last frames of the series, the light gray arrowindicates the location of activated cortex in the contralateral hemisphere, the dark gray arrow indicates the location of activated cortex in the ipsilateral hemisphere, and theinset indicates the location of the stimulus. Every stimulus position except the VM produced a non-mirror-symmetric pattern of cortical activation.

