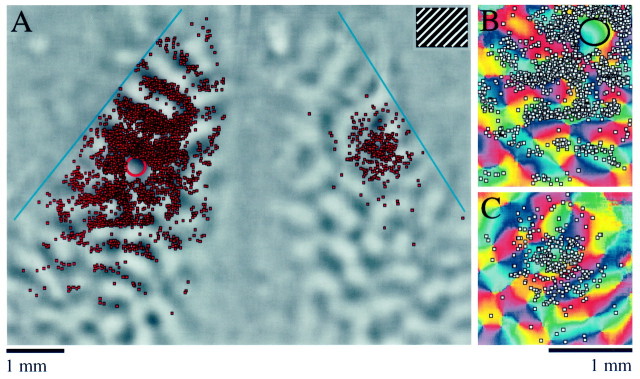
Fig. 8.
Comparison of modular specificity of intrinsic and callosal connections in a single animal (animal TS9824). A single injection of red beads was made in this animal in an area of the left cortex that had an orientation preference of near 60°, and the labeled cells in both hemispheres were plotted. A, Injection and labeled cells shown over an orientation difference image in which dark areas indicate regions of cortex that responded preferentially to a 45° grating. The red circle indicates the limits of the injection site, andred squares indicate red bead-labeled cells. Labeled cells are found in a distribution that is elongated along roughly the rostrocaudal axis, corresponding to the preferred orientation of the injection site, and are found preferentially over dark areas of the difference image in left cortex. Labeled cells in the opposite hemisphere are found in a more restricted and symmetrically shaped distribution and show no preference for dark or light domains.B, Distribution of labeled cells found in the left cortex shown over an orientation preference map for that hemisphere. Labeled cells tend to lie over blue and green regions of the orientation preference map, indicating a preference for sites with orientation preferences between 45 and 90ο.C, Distribution of labeled cells found in the right hemisphere displayed over an orientation preference map for that hemisphere. Labeled cells show no preference for a particular orientation. Orientation preference is color-coded according to key shown in Figure 7. Scale bar in C applies toB and C.

