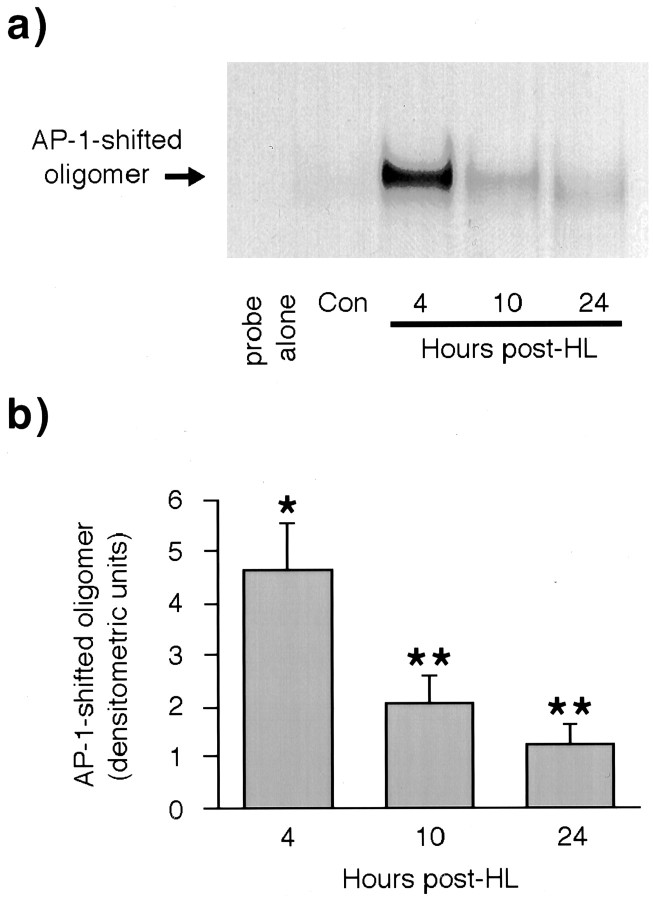
Fig. 5.
EMSA analysis of AP-1 binding 4, 10, and 24 hr after HL. a, Representative EMSA gel showing time course of AP-1 binding to NGFAP1 probe using dentate gyrus nuclear extracts from naive rats and rats killed 4, 10, and 24 hr after HL. b, Quantitation of AP-1 binding profile based on densitometric evaluation of EMSA gels from five independent experiments. Bars show group means ± SEM. *p < 0.05 compared with values obtained with extracts from control rats; Fisher's PLSD post hocanalysis. **p < 0.05 compared with values obtained with extracts from control rats and 4 hr post-HL rats; Fisher's PLSDpost hoc analysis.

