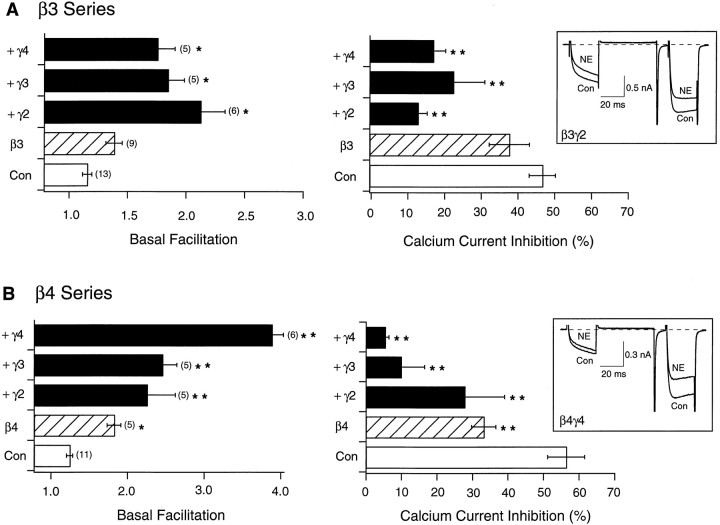
Fig. 3.
Effect of heterologous overexpression of Gβ3 and Gβ4 alone or with Gγ2, Gγ3, and Gγ4 on facilitation and NE-mediated inhibition of Ca2+ currents.A, B, Summary graphs of mean ± SEM basal facilitation and Ca2+ current inhibition for neurons expressing either β3 or β4 alone and combined with several γ subunits. Final concentration of cDNA injected was 10 ng/μl per subunit. Basal facilitation and Ca2+ current inhibition were calculated as described in Figure1E. Note that scales for basal facilitation are different. Numbers in parentheses indicate the number of experiments. Insets show superimposed current traces evoked with the double-pulse voltage protocol (illustrated in Fig.1D) in the absence or presence of 10 μm NE for β3γ2- and β4γ4-expressing neurons. *p < 0.05 versus control; **p< 0.01 versus control.

