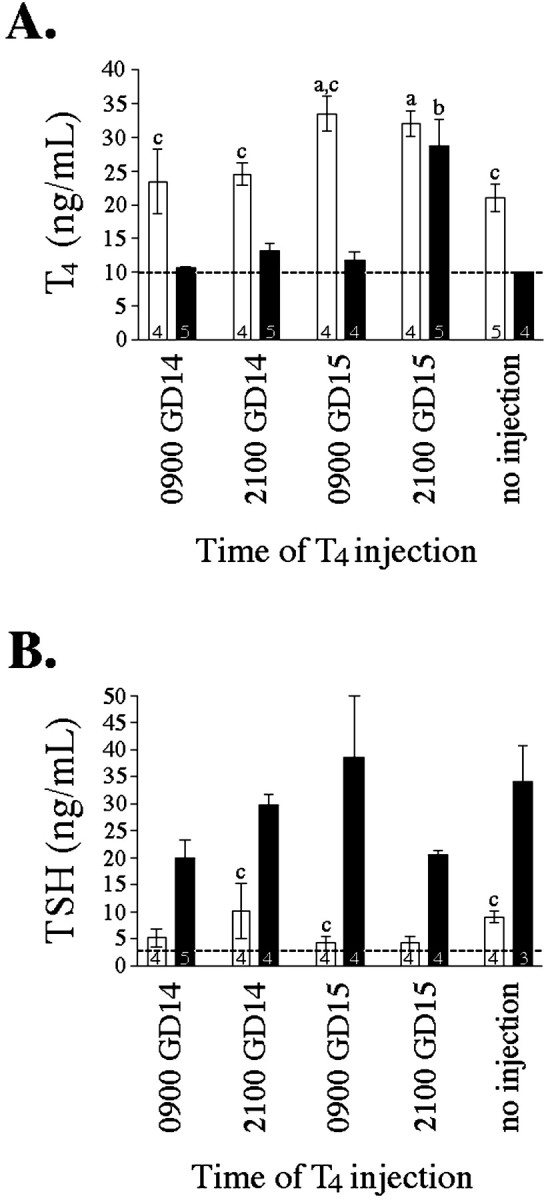
Fig. 2.

Effect of MMI and T4 injections on serum levels of T4 (A) and TSH (B) in GD16 pregnant females at the time they were decapitated (Experiment II). See Materials and Methods for details of thyroid hormone manipulation. Bars represent mean ± SEM, with number of dams per group noted within each bar. All animals were killed at 9 A.M. (0900) on GD16. Groups differed in the timing of T4 injection as shown below the ordinate. Open bars, Euthyroid dams (no MMI); closed bars, hypothyroid dams (MMI). a Significantly different from euthyroid dams receiving no injection (p < 0.05). b Significantly different from hypothyroid dams receiving no injection (p < 0.05).c Significantly different from hypothyroid dams with identical timing of acute T4 treatment (p < 0.05). Note: Serum hormone levels below detection limit were assigned the value of the detection limit (indicated by dashed line) for statistical purposes.
