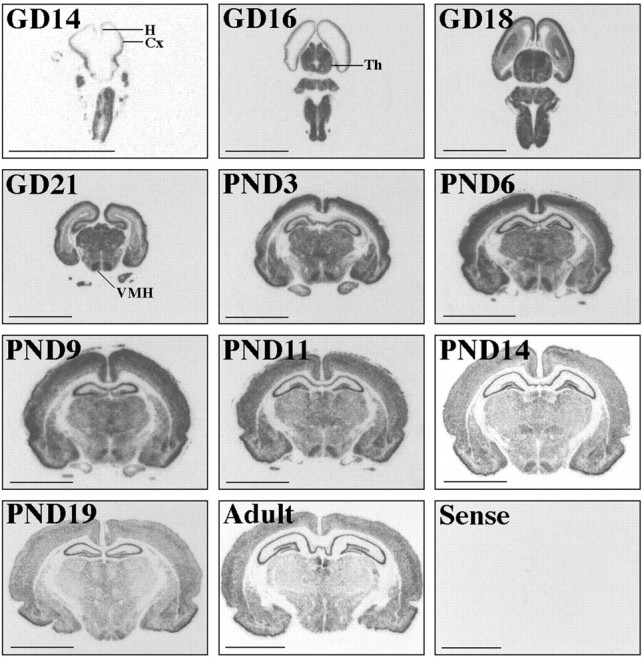
Fig. 5.

Developmental profile of NSP expression in the rat. Images are derived from film autoradiograms after in situ hybridization using the NSP cRNA probe (Experiment III). Age is noted in the top left corner of each panel.Cx, Cortex; H, hippocampus;Th, thalamus; VMH, ventromedial hypothalamus. Scale bar, 0.5 cm.
