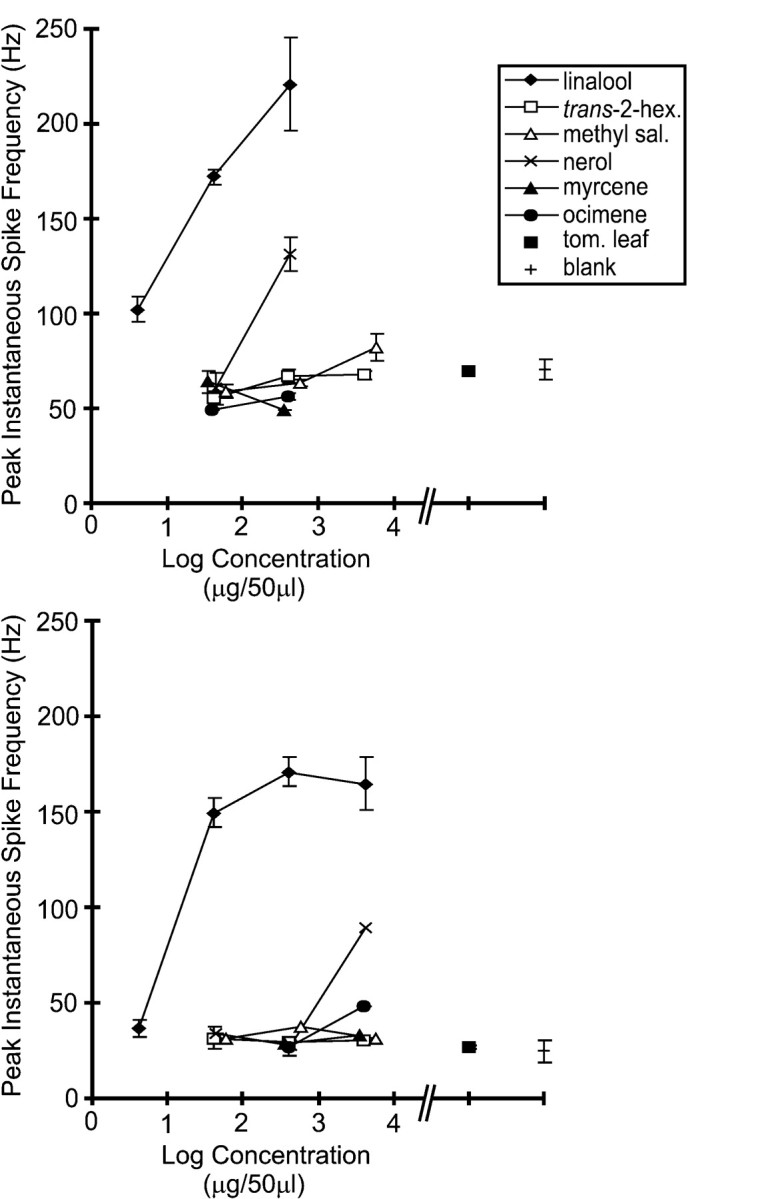
Fig. 8.

Dose–response curves for two latLFG-PNs. To explore their response characteristics, some of the latLFG-PNs were tested with a wider selection of monoterpenoids (Fig. 1) at various concentrations. Dose–response curves were constructed by plotting the mean peak instantaneous spike frequency (means ± SEM) versus concentration. The plots show that linalool was the strongest stimulus for both neurons. Nerol could also elicit an excitatory response from these cells, but a much higher concentration was required, and the peak instantaneous frequency was still substantially lower than that attained during the excitatory response to linalool. These two latLFG-PNs differed in their background firing rates and their overall sensitivities to linalool. The PN in the top panel (PN6 in Fig. 7) exhibited a higher background firing rate (∼50 sec−1) and greater overall sensitivity to linalool in comparison to the PN in thebottom panel (PN 5 in Fig. 7).
