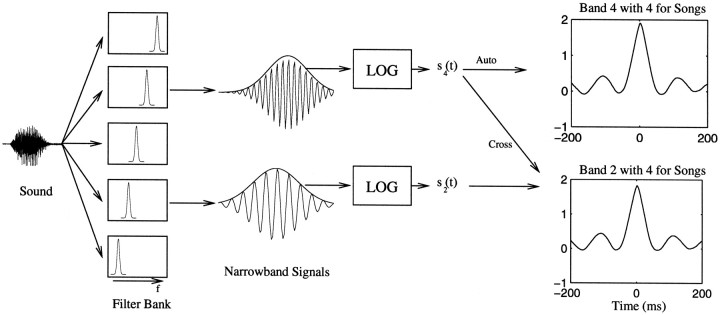
Fig. 1.
Schematic illustrating the spectrographic decomposition and the calculation of the stimulus autocorrelation matrix. The sound is decomposed into frequency bands by a bank of Gaussian filters. The result is a set of narrowband signals with time-varying amplitude and phase. Our representation of sound is based on the time-varying amplitude envelopes. Although the time-varying phase is discarded, the relative phase across frequency bands is preserved because of the large overlap between adjoining filters. The time-varying amplitude envelope or its log is what is usually represented in a spectrogram. Our representation of sound and the spectrograms shown in this paper are based on the log of the amplitude envelopes. The stimulus autocorrelation function is then found by cross-correlating the log-amplitude envelope of a particular band with the log-amplitude envelope of all the other bands, including itself. The autocorrelation for the entire ensemble is done by averaging the correlation at each time point for all stimuli in a given ensemble. Here we show the results of two of such pairwise correlations: the correlation of band 4 (centered at 1250 Hz) with band 2 (centered at 500 Hz) and of band 4 with itself, for the song ensemble.

