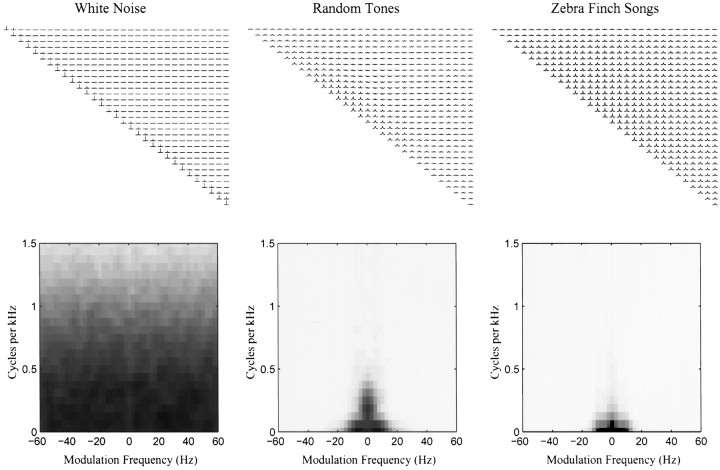
Fig. 5.
Stimulus autocorrelation matrices (top panels) and two-dimensional power spectra (bottom panels) for a white noise ensemble and the random tone-pip and song ensembles used in this paper. The diagonal corresponds to the autocorrelation of the log of amplitude envelope of each frequency band with itself. The off diagonal terms correspond to the cross-correlation between the log of amplitude envelopes across frequency bands. The bands are ordered in increasing frequency from left toright and top to bottom. The top left corner corresponds to the autocorrelation of the amplitude envelope in the 250 Hz band. Only the top right side of the matrix is shown because it is symmetric along the diagonal (with the time axis inverted for the bottom left entries). The time window of each autocorrelation function is from −200 to +200 msec as shown in Figure 1. The ideal white noise signal would have null functions in the off-diagonal terms and delta functions in the diagonal terms. The white noise signal approaches this ideal. The random tone pip ensemble is also closer to white noise than the song ensemble but still has the spectral and temporal structure that is a result of our design (see Materials and Methods and Results). The bottom panels show the two-dimensional power spectra of the stimulus ensemble. These two-dimensional power spectra are obtained by taking the square of the two-dimensional Fourier transform of the stimulus in their spectrographic representation. The two-dimensional power spectra illustrate the temporal and spectral correlations of the stimulus in the Fourier domain. The x -axis shows the frequency of temporal modulations, and the y -axis the frequency of the spectral modulations found in spectrograms of the different sounds. The two-dimensional power spectra are symmetric around the origin and therefore only the top quadrants are shown. The two-dimensional power spectra can be obtained directly from the autocorrelation matrix of the stimulus (top row), although the reverse is only true if the correlations along the spatial (spectral) dimension are stationary.

