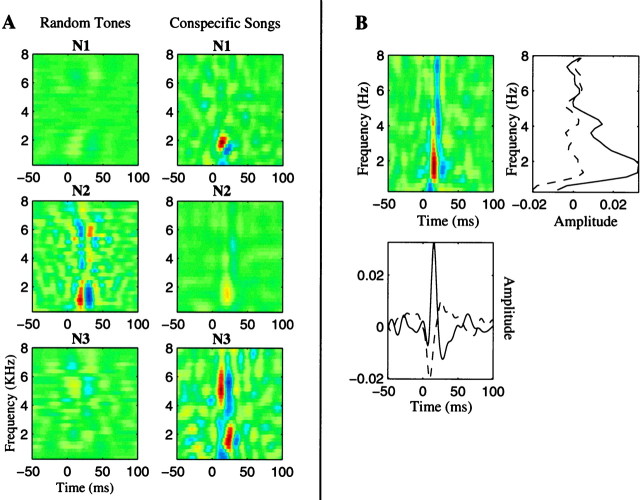
Fig. 9.
STRFs derived using the random tone pip and song ensemble for three neuronal sites (N1–N3) with complex stimulus response properties (A) and decomposition of an STRF onto its spectral axis and temporal axis (B). In A, each row corresponds to the two STRFs that were obtained for a particular site. The left column corresponds to the STRF calculated from the random tone pip ensemble, and the right column corresponds to the STRF calculated from the song ensemble. These three examples were chosen to illustrate cases in which the STRF obtained from the random tone pip ensemble was different from the one obtained from the song ensemble. These particular sites were in L1 (N1 and N3) and L3 (N2). The STRFs differ both in amplitude and in shape. The top neuronal site can be described as being sensitive to a moving spectral edge. Similar STRFs have been found in some cortical neurons (deCharms et al., 1998). The bottom neuronal site is sensitive to a temporal combination of a low-frequency sound followed by a high-frequency sound. Both of these complex spectral-temporal responses became evident only when the song ensemble was used. In B, the STRF of the neuron of Figure 8 is projected onto its spectral axis (top right) and temporal axis (bottom left). Such analyses can be used to extract the spectral and amplitude modulation tuning of the neurons as explained in Results. Thesolid line is the projection corresponding to the largest excitatory point, and the dotted line is the projection corresponding to the largest inhibitory point.

