
Fig. 3.
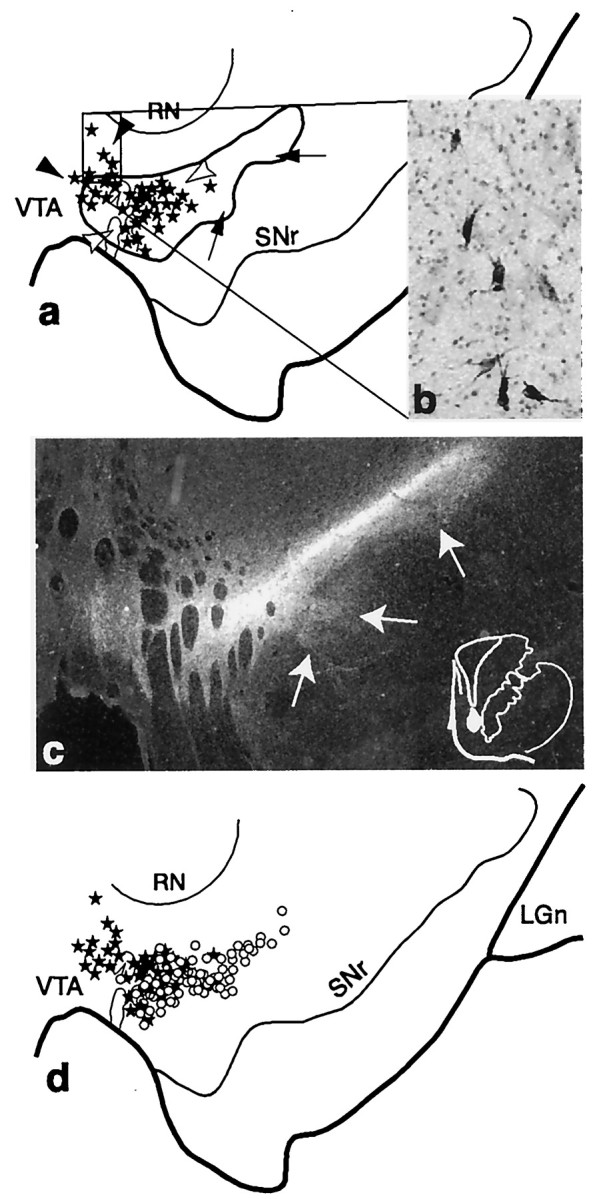
The shell SNS projection system illustrating the three components within the midbrain. a, Schematic of the midbrain showing the combined distribution of labeled terminals (outline) and cells (black stars; each = 4–6 cells) after all shell tracer injections. Black arrowheads indicate cells dorsal to terminals, white arrowheads indicate the region of cells within the shell terminal field, and arrows point to terminals ventral and lateral to cells projecting to the shell. b, Photomicrograph taken from the region outlined in a(box) of labeled cells after a WGA-HRP injection into the dorsal shell or cone region (case 82). c, Dark-field photomicrograph of the midbrain showing the distribution of terminals (silver grains) after a tritiated amino acid injection into the dorsal shell (injection site shown at right) (case 93AA). Note that some terminals extend into the dorsal part of the densocellular region (arrows). d, Schematic comparing the distribution of labeled cells from collective shell injections (stars) with those from collective core injections (open circles). One star or circle = 4–6 cells.LGn, Lateral geniculate nucleus; RN, red nucleus; SNr, substantia nigra, pars reticulata;VTA, ventral tegmental area.