
Fig. 1.
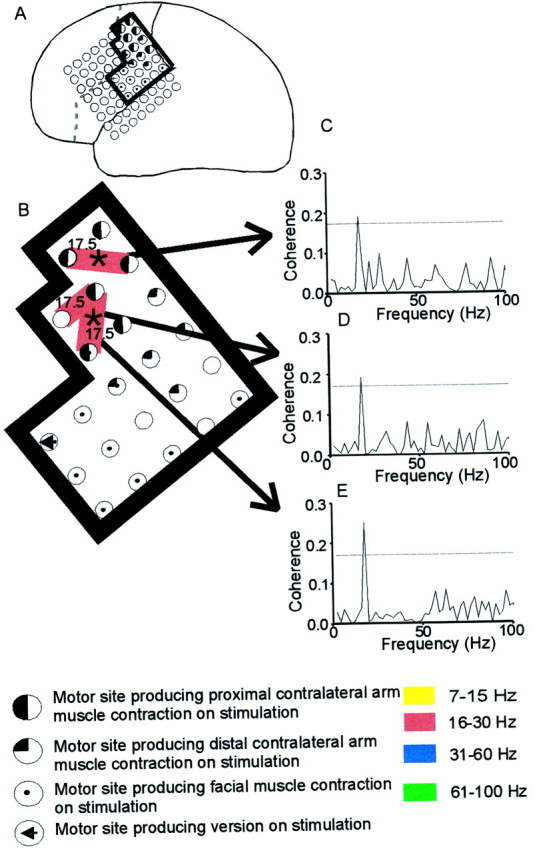
ECoG–EMG coherence at specific frequencies.A, Case 6, Location of the subdural grid. In this and Figure 2, black and graylines are the central sulcus and the surgical resection line, respectively, and the black boxed area is that analyzed. B, Coherence (significant at the 95% level after Bonferoni correction) between the left bipolar ECoG and right wrist flexors during tonic contraction. Circles indicate the electrode positions, and connecting lines indicate that significant coherence was observed between this bipolar electrode pair and muscle. The frequency band of significant coherence is color-coded, and the functional properties of the electrodes are indicated in the key. All three sites showed coherence with muscle at 17.5 Hz, as indicated in the coherence spectra in C–E. *Indicates that at this site the coherence at 17.5 Hz was significantly higher than that seen during a phasic contraction. The bipolar sites giving spectra D and E were themselves coherent at 17.5 Hz, with activity simultaneously recorded from the more rostral site giving C.