
Fig. 2.
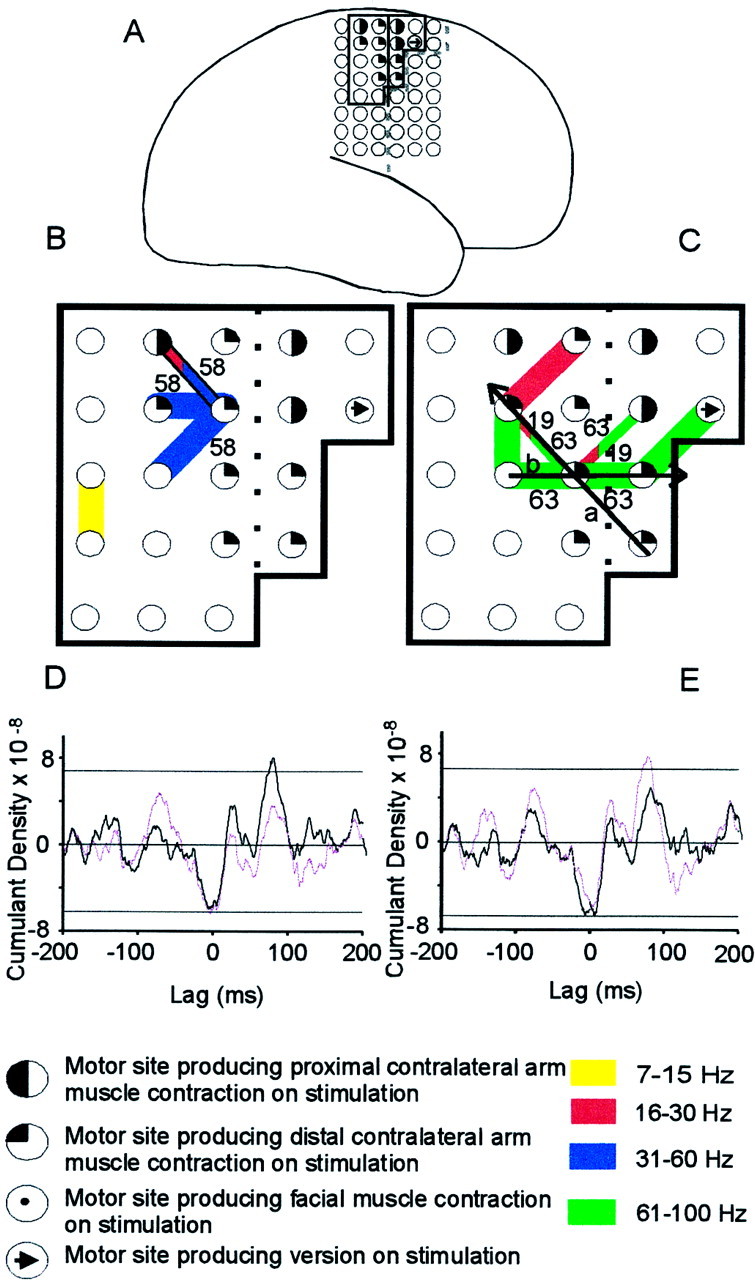
Task-related changes in ECoG–EMG coherence.A, Case 5, Location of the subdural grid.B,C, Coherence between the right bipolar ECoG and left first dorsal interosseous during tonic (B) and phasic (C) contractions. Note that activity in the high gamma band (61–100 Hz) was only found during phasic contractions. Key is shown below.D,E, Cumulant density estimates during phasic contraction calculated between muscle and ECoG. InD, ECoG activity was recorded from the two adjacent bipolar pairs, indicated by the diagonal arrow inC. In E, ECoG activity was recorded from the two adjacent bipolar pairs, indicated by the horizontal arrow in C. The cumulant density estimates calculated for sites a or b are indicated by a purple line in D andE and have been inverted to highlight polarity reversal. The top and bottom horizontal linesindicate the 95% (Bonferoni corrected) confidence levels.