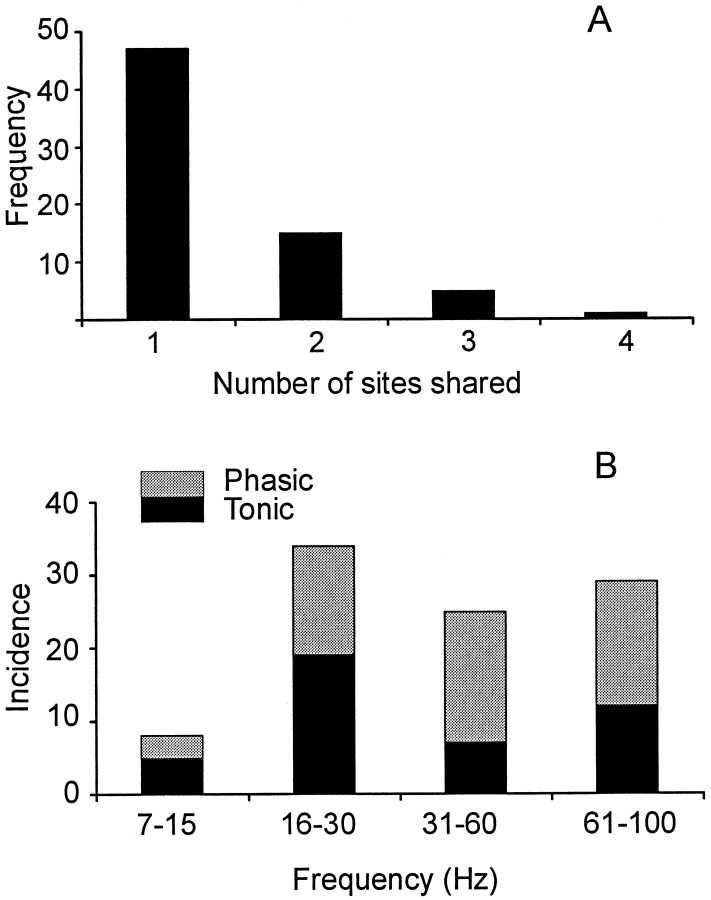
Fig. 3.
Summary of frequency sharing between electrodes and changes in frequency with task. A, Frequency histogram of the number of ECoG–EMG coherence spectra sharing a peak at the same frequency in a given record (pooled across all patients).B, Total incidence of significant coherence within the four frequency bands during both tonic and phasic contractions across all patients. In both A and B all significant points were counted when coherence spectra demonstrated more than one discrete significant peak.

