
Fig. 1.
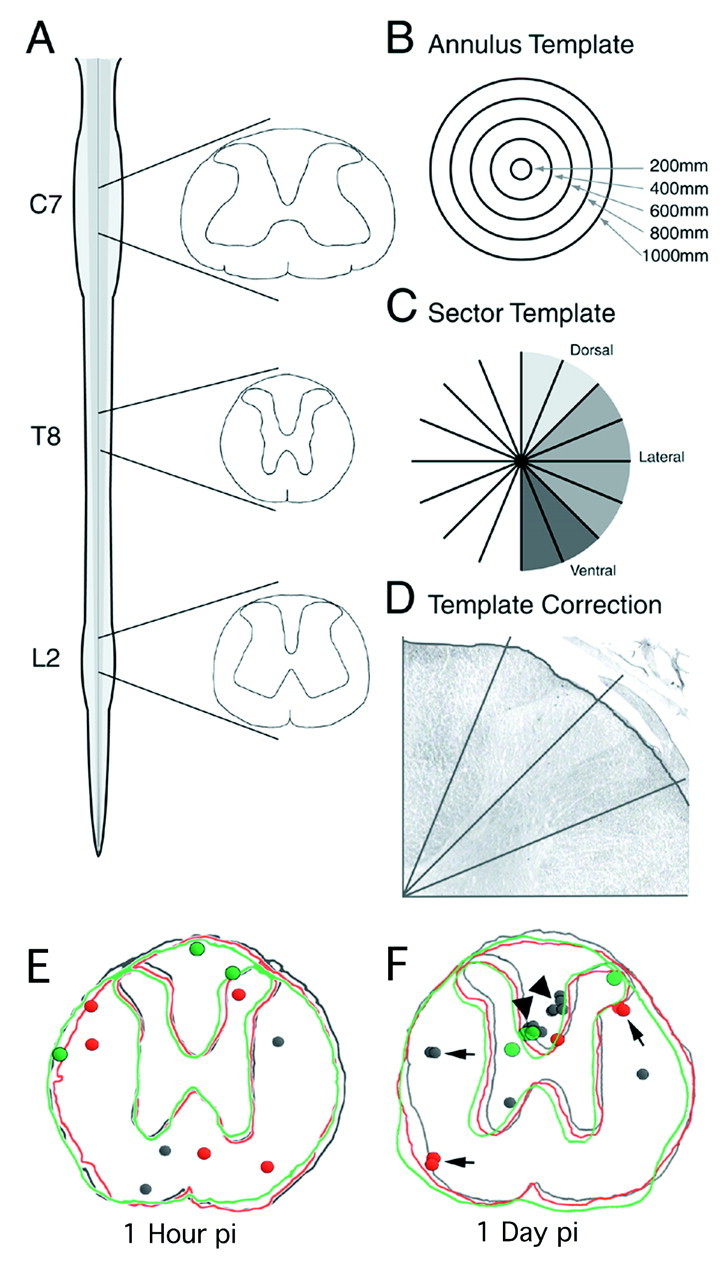
Quantitative method for counting BrdU-positive nuclei in the intact spinal cord. Coronal sections (40 μm) from C7, T8, and L2 were selected for quantitation and immunohistochemically labeled for BrdU (A). Electronic templates that divided the spinal cord into concentric annuli (B) and radial sectors (C) were overlaid onto stained sections. With the aid of an image analysis system, the perimeters of the templates were delineated by electronically circumscribing the outer circumference of each tissue section (D). The limit was drawn just beneath the pial surface. All BrdU-positive nuclei were counted, and the area of each region was calculated after the regions were delineated. BrdU-labeled cells at the ependymal layer of the central canal were counted independently. BrdU distribution and cell migration was determined in a group of animals, where a single injection of BrdU was given followed by killing at 1 hr or 1 day after injection (E, F). Three consecutive 40 μm sections from a representative animal were traced at the level of T8.Dots indicate the presence of a BrdU-labeled nucleus. Each section and corresponding nuclei are represented as a separate color. At 1 hr pi most BrdU-labeled cells are found as single nuclear profiles, and nuclei are distributed in the medial and outer circumference of the spinal cord (E). At 1 day pi, the number of BrdU-labeled nuclei increases, and many of the nuclear profiles are located in clusters of two (arrows) and four (arrowhead) nuclei, indicating cell division.